
Income Reference Guide, Census of Population, 2021
Release date: March 30, 2022 (preliminary) Updated on: December 15, 2022
Skip to text
Text begins
Definitions and concepts
The Census Program gathered income information solely from administrative data sources for the first time in 2016. The 2021 Census Program continued to use administrative files to produce detailed data for income sources. The use of administrative data not only reduced response burden, but also increased the quality and quantity of income data available.
Integrating income data from the Canada Revenue Agency’s tax and benefits records into the short-form census allows for the production of income statistics for individuals, families and households in Canada at fine levels of geography.
Used alone or in conjunction with the ethnocultural, educational and labour characteristics collected in the long-form census, income data can shed light on many socioeconomic issues of interest to Canadians. For example, income statistics generated from the census allow Canadians to understand patterns of prosperity, such as differences between geographic areas, between sexes, between older and younger age groups, or between population groups. Income statistics inform Canadians which occupations and industries pay more than others, and, for postsecondary graduates, which fields of study pay more. They also permit Canadians to understand trends in poverty and income inequality.
Governments use income statistics to monitor well-being and to develop income support programs and social services, such as child benefit programs, employment insurance programs, provincial income supplements and welfare payments.
Large and small businesses use income statistics to plan where to locate stores near consumers and to develop new products and services.
Private sector and public sector researchers, as well as academics, use income data to study labour markets and industrial patterns, and to compare incomes across neighbourhoods, cities or regions, and subpopulations, including equity-deserving groups, such as low-income families, Indigenous people (including the on-reserve First Nations population), visible minorities and immigrants.
Individual income information was compiled for the population aged 15 and older at the time of the census. All income received during the calendar year 2020 was included: taxable and non-taxable, regular and recurring. One-time receipts, such as lump-sum withdrawals from registered retirement savings plans (RRSPs) and other savings plans, lump‑sum insurance settlements, lump-sum pension benefits, capital gains or losses, inheritances, and lottery winnings, were excluded.
Users should be aware that Statistics Canada uses income definitions that do not always correspond to income concepts used by other organizations. For example, the definition of total income adopted by the Census of Population Program does not correspond to the total income on line 15000 of the T1 Income Tax and Benefit Return that the Canada Revenue Agency uses for income tax purposes.
All variables included in the census are defined in the Dictionary, Census of Population, 2021, Statistics Canada Catalogue no. 98-301-X. Additional information about the census can be found in the Guide to the Census of Population, 2021, Statistics Canada Catalogue no. 98‑304‑X.
Total income consists of two broad classes of income: market income and government transfers. These two broad classes of income can be further classified into the following categories to allow for more detailed income analyses.
For an illustration of the hierarchical structure of the income components, please refer to the figure in Appendix 2.4 Components of income in 2020, or to the detailed classification of income sources.
After-tax income is a useful measure of funds available to a household, family or individual for consumption, saving and investment. It is derived by deducting income taxes from total income. Income taxes consist of net federal income tax and provincial and territorial income taxes.
To complement the income concepts, several related variables are also available:
- net capital gains or losses
- payroll deductions, namely contributions to employment insurance (EI), contributions to the Canada Pension Plan (CPP) and Québec Pension Plan (QPP) and contributions to registered pension plans (RPP)
- contributions to savings accounts, namely contributions to tax-free savings accounts (TFSA) and contributions to registered retirement savings plans (RRSPs).
In addition to the aforementioned concepts that are common between the short-form and long-form questionnaires, variables related to the Market Basket Measure (MBM)—a low-income concept originally developed by Employment and Social Development Canada (ESDC)—are also available (but only for the long-form census questionnaire). In 2018, the Poverty Reduction Act established the MBM as Canada’s Official Poverty Line. The MBM methodology undergoes periodic reviews and updates. The 2021 Census reports MBM low-income statistics according to the 2018-base MBM, which is the current version of the MBM as of Census Day. Disposable income for the MBM is the income amount available, after adding the tenure type adjustment for the MBM (Table 2.3 Tenure type adjustment for the Market Basket Measure [MBM], 2020) and deducting the non-discretionary spending for the MBM from the after-tax income. Non-discretionary spending for the MBM includes mandatory payroll deductions, health care expenses, child care expenses paid and child or spousal support payments.
Since income may be pooled to pay for shared expenses, such as food and shelter, it is often useful to examine the situation of a family or a household by summing the income of family or household members. Total income and after-tax income have been derived at various levels of aggregation:
- after-tax income of census family
- after-tax income of economic family
- after-tax income of household.
Definitions for census family, economic family, household and private household can be found in the Dictionary, Census of Population, 2021, Statistics Canada Catalogue no. 98-301-X. Figure 2.2 Family membership and family status, in the Census Dictionary, illustrates the relationships and classifications of people at each aggregation level.
Statistics such as the average or the median can be calculated for all income variables. Notes on the methodology behind the production and derivation of these statistics, at the population level and other levels of aggregation, are available in Appendix 2.3 Derived statistics, of the Dictionary, Census of Population, 2021, Statistics Canada Catalogue no. 98-301-X.
In 2021, as part of the measures to ensure non-disclosure of individual characteristics, the average and aggregate income statistics are available only from the sampled population, i.e., from the long-form census questionnaire. The median income statistics are the measure of central tendency that is available for 100% of the population (short‑form census questionnaire).
To facilitate comparisons across families or households of different sizes, adjusted family and household incomes are also provided. Adjusted incomes are computed by dividing family or household incomes by a factor equal to the square root of the family or household size (known as the equivalence scale). This adjustment for different family or household sizes takes into account economies of scale. It reflects the fact that the needs of a family or household increase, but at a decreasing rate, as the number of members increases. These adjusted incomes are also suitable for computing inequality indicators, such as the Gini coefficients (Appendix 2.3 Derived statistics). The adjusted family and household income variables are:
- adjusted total income of economic family
- adjusted total income of person not in economic family
- adjusted total income of household
- adjusted after-tax income of economic family
- adjusted after-tax income of person not in economic family
- adjusted after-tax income of household.
In standard income products that include historical data, dollar amounts have been adjusted and given, where necessary, in 2020 constant dollars, using the national annual average all-items Consumer Price Index (CPI). More specifically, income for a given reference year in current dollars is adjusted and given in 2020 constant dollars by multiplying the nominal income for that reference year by an adjustment factor equal to the CPI for 2020 divided by the CPI for that reference year.
Impact of COVID-19 pandemic on incomes of Canadians
The year 2020 saw the introduction and enhancement of several government income-support programs in response to the economic impact of the COVID-19 pandemic. Some of these government transfers were one-time transfers, while others were recurring payments. In the standard income sources classification, new benefits are included in the government transfers not included elsewhere category.
To facilitate analysis of the economic impact of the COVID-19 pandemic, other classifications of government transfers, which set COVID-19-related income support programs apart from other government transfer income, are possible. The components of government transfers that are specific to the COVID-19 income support programs available separately are the following:
COVID-19 – Government income support and benefits
- COVID-19 – Emergency and recovery benefits
- COVID-19 – Enhancements to existing federal programs
- COVID-19 – Provincial and territorial benefits.
Another enhancement to the 2021 Census is the inclusion of a few crucial income sources for reference year 2019 that provide baseline information to assess the economic impact of the COVID-19 pandemic. The income sources available for reference year 2019 are market income, employment income (including wages, salaries and commissions and net self-employment income), government transfers (including Employment Insurance [EI] benefits), total income and after-tax income at the individual level. Based on the national annual average all-items CPI, these income sources for 2019 are presented in 2020 constant dollars.
Reference periods
Users should take note of the reference periods or reference dates when analyzing income data with other variables. The reference period for income data is the calendar year 2020, unless otherwise specified. The demographic variables collected on the questionnaire, such as age and family status, reflect respondents’ characteristics on the census reference day, May 11, 2021.
Some labour or employment variables from the long-form questionnaire, such as hours worked for pay or in self‑employment and labour force status, refer to the job held during the reference week of Sunday, May 2, to Saturday, May 8, 2021, and not calendar year 2020. Other labour variables, such as class of worker, industry and occupation, refer to the job held during the reference week of Sunday, May 2, to Saturday, May 8, 2021, or to the most recent job held since January 1, 2020. Therefore, the employment income from 2020 may or may not correspond to the job reported. This phenomenon may be more prominent in certain industrial sectors as a result of the varying repercussions of the COVID-19 pandemic throughout 2020. The annual income concepts used offer a broad understanding of the economic situation of individuals in the context of the census. Users interested in labour conditions or hourly wages at specific points in time should consider alternate data sources, such as the Labour Force Survey.
Five labour variables have the same reference period as the income data: weeks worked during the reference year, full-time or part-time weeks worked during the reference year, main reason for not working the full year, main reason for working mostly part time and work activity during the reference year. Additional information about the labour topic can be found in the Labour Reference Guide, Census of Population, 2021, Statistics Canada Catalogue no. 98-500-X.
In the housing analysis, income data are used with shelter costs to compute the housing variable shelter-cost-to-income ratio. This ratio is used in key housing indicators, such as the housing affordability and the core housing need indicators. Minor inconsistencies arise because these shelter cost variables, as well as their components—condominium fees; annual payment for electricity; annual payment for fuels; annual payment for water and other municipal services; annual property taxes; monthly mortgage payment; rent, monthly cash; and monthly use or occupancy payment for dwelling—were collected either for the most recent month or for the last 12 months before the reference period, whereas the income data were always for the previous calendar year. Additional information about the housing topic can be found in the Housing Characteristics Reference Guide, Census of Population, 2021, Statistics Canada Catalogue no. 98-500-X.
Questions
For the 2021 Census, the 2A short-form questionnaire was used to enumerate all usual residents of 75% of private dwellings. The 2A-L long-form questionnaire, which also includes the questions from the 2A short-form questionnaire, was used to enumerate a 25% sample of private households in Canada. For private households in First Nations communities, Métis settlements, Inuit regions and other remote areas, the 2A-R questionnaire was used to enumerate 100% of the population.
For the 2021 Census, income information was produced using administrative files. Data for two questions related to non-discretionary spending (Question 56, child care expenses paid, and Question 57, child or spousal support payments) were collected on the 2A-L and 2A-R long-form questionnaires to produce statistics related to the Market Basket Measure (MBM) low-income concept. For more information, see the Collection and processing methods section of this reference guide.
For more information on the reasons why the census questions are asked, please refer to the five fact sheets found on The road to the 2021 Census web page.
Classifications
Quantitative income variables can be converted into qualitative variables to make classifications for tabulation purposes.
Income recipients can be classified based on their given income source. For instance, people aged 15 and over with employment income are classified as earners or employment income recipients.
The population can also be categorized into income groups. One such classification method is based on deciles; it classifies individuals into ten income groups containing equal numbers of people.
The idea of dividing distributions into deciles can be applied to any income concept. The economic family after-tax income decile group variable is derived based on the ranking of the adjusted after-tax income of economic families and persons not in economic families living in private households. The total income decile group variable is derived based on the ranking of the total income of the population aged 15 years and over living in private households. The employment income decile group variable is derived based on the ranking of the employment income of all the employment income recipients living in private households.
People, families and households can be assigned a low-income status based on different low‑income concepts. The Market Basket Measure (MBM), Canada’s official measure of poverty, is available for the sample of those who completed the long-form questionnaire. The other low-income concepts—Low-income measure, after tax (LIM-AT); Low-income measure, before tax (LIM-BT); Low-income cut-offs, after tax (LICO-AT); and Low-income cut-offs, before tax (LICO-BT)—are available for both the short-form and the long-form census questionnaires.
These concepts differ according to the income variable used (before-tax income, after-tax income or disposable income for the MBM), the aggregation level (economic families and persons not in economic families or households) and the source of the applicable threshold.
Table 2.1 Summary of low-income lines in the 2021 Census of Population Program, summarizes the different characteristics of each measure.
The actual threshold amounts for calendar year 2020 are provided in the following tables:
- Table 2.2 Market Basket Measure (MBM) thresholds for economic families and persons not in economic families, 2020
- Table 2.4 Low-income measures thresholds (LIM-AT and LIM-BT) for private households of Canada, 2020
- Table 2.5 Low-income cut-offs, after tax (LICO-AT ‒ 1992 base) for economic families and persons not in economic families, 2020
- Table 2.6 Low-income cut-offs, before tax (LICO-BT ‒ 1992 base) for economic families and persons not in economic families, 2020.
For each of these methods, once the low-income status has been assigned, it is possible to compute several low-income indicators:
Concepts over time
The income concepts available in the Census of Population Program are developed in accordance with the guidelines and recommendations of international standards. Statistics Canada reviews and updates, on a regular basis, the derivation of each income component to ensure the concept stays current, based on the evolution of society and databases. Since the 2016 Census, there have been legislative changes to some government benefit programs for individuals, such as the Canada child benefits and the Canada workers benefit. In addition, the COVID-19 pandemic in 2020 brought about many new government programs to provide Canadians with income support. The changes that affect various government transfer income categories are detailed in the Dictionary, Census of Population, 2021, Statistics Canada Catalogue no. 98-301-X.
In 2016, the Market Basket Measure (MBM) was one of the five low-income concepts covered in the Census of Population Program. It adopted the latest MBM methodology at the time—the 2008-base MBM, revised in 2011. In 2018, the Government of Canada released Canada’s first Poverty Reduction Strategy and named the MBM Canada’s official measure of poverty. It further mandated Statistics Canada to review the measure on a regular basis “to ensure that it reflects the up-to-date cost of a basket of goods and services representing a modest, basic standard of living in Canada.” As a result, Statistics Canada launched a comprehensive review of the MBM and, in 2020, established the 2018-base MBM.
The 2021 Census adopts the 2018-base MBM. For more information, see Market Basket Measure (MBM) in the Dictionary, Census of Population, 2021. Furthermore, to help track poverty rates outlined in the poverty reduction strategy, the 2018-base MBM is now available for both the 2016 and 2021 censuses.
Two other measures of low income, the Low-income measure, before tax (LIM-BT) and the Low-income measure, after tax (LIM-AT), have also been adjusted for the 2021 Census to enhance their coverage. In contrast to the past, the territories and the on-reserve population are now included in the computation of these measures. For more information, see Low-income measure, before tax (LIM-BT), Low-income measure, after tax (LIM-AT) and Low-income statistics for the population living on reserve and in the North using the 2016 Census in the Income Research Paper Series, Statistics Canada Catalogue no. 75F0002M.
Collection and processing methods
The COVID-19 pandemic emerged in Canada in early 2020 and affected all steps of the 2021 Census process, from data collection to dissemination. Please refer to the Guide to the Census of Population, 2021, Statistics Canada Catalogue no. 98-304-X, for more detailed information on this topic.
Income variables were constructed using various administrative tax and benefits records from the Canada Revenue Agency (CRA), rather than collected through the questionnaires.
To provide as extensive coverage on income data as possible, both tax filers and non-tax filers known to the agency were included when performing record linkage between the census and the CRA administrative database. Tax filers were those who filed a tax return for calendar year 2020. Non-tax filers did not file a tax return for 2020, but certain administrative information is available for them.
There were three main types of administrative data from CRA. The first type came from the T1 Income Tax and Benefit Return filings; thus, only tax filers had this information. The second type was associated with tax slips issued by employers (e.g., T4), financial institutions (e.g., T3, T4A, T4RIF, T4RSP, T5) and administrators of various government programs (e.g., T4A(P), T4A(OAS), T4E, T5007). Slip information was available for both tax filers and non-tax filers. The third type of data, also available for both tax filers and non-tax filers, was related to government programs administered by CRA, such as the Canada child benefit program and the goods and services tax/harmonized sales tax credit program.
Thus, respondents who were tax filers would have complete information to construct all the person-level variables identified in the Definitions and concepts section. For respondents who were not tax filers, the information available was sufficient to populate only certain variables. Variables that could not be produced using the available input were resolved through imputation. Respondents not linked to any CRA administrative records would initially have no income data at all; imputation was used to determine all of the income fields. Details on the scope and impact of imputation are provided in the Data quality section.
For income concepts available for reference year 2019, as described in the Concepts over time section, they are appended to the census via data linkage with an income file that is produced annually, using administrative sources, in accordance with the conceptual standards adopted by the census.
In addition to the administrative data, data related to non-discretionary spending were collected in two questions on the 2A-L and 2A-R long-form questionnaires to produce statistics related to the Market Basket Measure (MBM) low-income concept developed by ESDC. Question 56 requested those who worked in 2020 to report child care expenses paid in 2020. Question 57 asked for the amount of child or spousal support payments made to a former spouse or partner in 2020.
Data quality
The 2021 Census of Population underwent a thorough data quality assessment. The different certification activities conducted to evaluate the quality of the 2021 Census data are described in Chapter 9 of the Guide to the Census of Population, 2021, Statistics Canada Catalogue no. 98-304-X.
The data quality assessment was conducted in addition to the regular verifications and quality checks completed at key stages of the census. For example, throughout data collection and processing, the accuracy of specific steps such as data capture and coding was measured, the consistency of the responses provided was checked, and the non-response rates for each question were analyzed. As well, the quality of imputed responses was assessed during data editing and imputation.
During the data quality assessment, a number of data quality indicators were produced and used to evaluate the quality of the data. These indicators are briefly described below. Finally, resulting census counts were compared with other data sources and certified for final release.
The main highlights of this assessment of the data pertaining to income are presented below.
Data quality indicators
A number of quality indicators were produced and analyzed during the 2021 Census of Population data quality assessment. Three indicators are available to data users for short-form content: the total non-response (TNR) rate, as well as the non-response rate and the imputation rate per question.
The total non-response (TNR) rate is the primary quality indicator that accompanies each disseminated 2021 Census of Population product, and is calculated for each geographic area. It measures total non-response at the dwelling level. Non-response is said to be total when no questionnaire is returned from a dwelling or when a returned questionnaire does not meet the minimum content. More information on the TNR rate is available in Chapter 9 of the Guide to the Census of Population, 2021, Statistics Canada Catalogue no. 98-304-X.
Partial non-response is when answers to certain questions are not provided for a respondent household.
The non-response rate per question is a measure of missing information due to non-response to a question. For the short-form questionnaire, the non-response rate per question includes both TNR and partial non-response to the question.
It is defined as the total number of in-scope units for which no response was provided to the question, divided by the total number of in-scope units for the question. Here, “units” refers to the statistical units for which data are collected or derived (e.g., persons or households, depending on whether the question is about a person-level characteristic or a household-level characteristic). A unit is considered to be in scope if it belongs to the census target population (i.e., private and collective dwellings occupied by usual residents) and if the question is applicable to that unit.
The imputation rate per question measures the extent to which responses to a given question were imputed. Imputation is used to replace missing data in the event of non-response or when a response is found to be invalid (e.g., multiple answers are provided when a single answer is expected). Imputation is conducted to eliminate data gaps and to reduce bias introduced by non-response. Imputation is generally done by identifying persons or households in the same geographical area with similar characteristics to the incomplete record and copying their values to fill in the missing or invalid responses.
The imputation rate per question is defined as the total number of in-scope units for which the response to that question was imputed, divided by the total number of in-scope units (see the definition of “units” provided in the above section on the non-response rate per question). For short-form content, imputation resolves both total and partial non-response (weighting is not done to adjust for total non-response, as it is for long-form content). Whole household imputation (WHI) is used to resolve total non-response. It first imputes the occupancy status of non-respondent dwellings and further imputes all the data for those dwellings resolved as occupied in the first step. WHI is included in the imputation rate per question, including the use of administrative data to impute non-responding households in areas with low response rates; see Appendix 1.7 of the Guide to the Census of Population, 2021, Statistics Canada Catalogue no. 98-304-X. As with the non-response rate, a unit is considered to be in scope if the question is applicable to that unit and the unit belongs to the census target population.
The non-response and imputation rates for a question are often similar, but some differences can be observed for a given question because of additional data processing steps that may have been required. These rates were regularly checked during data assessment, and a detailed analysis was done if there was a difference between the two rates for a question, to ensure the appropriateness of the processing steps taken and the quality of the data. A difference between the non-response rate and the imputation rate for a question can generally be explained by one of the following two factors:
- Some responses were considered invalid or inconsistent during the edit stage and imputation was needed, which is why the imputation rate is higher than the non-response rate for a question.
- Some non-responses were resolved in a straightforward manner early during data processing because a single resolution was possible based on the answers provided to other questions, making imputation unnecessary. This may explain why the non-response rate is higher than the imputation rate for a question.
To reduce the burden on Canadians, Statistics Canada did not ask questions related to income but instead linked census respondents to various tax and benefits records that are already available from the Canada Revenue Agency (CRA). Nevertheless, data quality indicators are also available for income concepts. Although they are defined differently, the interpretation and use of these data quality indicators are similar.
For income variables, the non-response rate provides information on the extent to which various income variables were missing information because a record from the CRA was not linked. Several income concepts, such as total income, are calculated using several pieces of information from CRA records. Sometimes parts of the information were missing, while other parts were available directly from CRA records. In these instances, the record was classified as a response if most of the information was directly obtained from CRA records. Thus, the non-response rate represents the proportion of in-scope records where most of the amount was not compiled directly from CRA records.
When an in-scope record was classified as a non-response, a value was imputed. As the income variables are in dollar values, a small imputed value will have a different impact on estimates than a large one. For this reason, the data quality flag measuring the imputation for income variables was defined differently to reflect the dollar amount imputed and is called the impact of imputation.
The impact of imputation per question can be interpreted as the proportion of the total of the variable for which values were imputed. Like the imputation rate per question, the impact of imputation does not take deterministic edits into account. For variables that are derived from various components, the impact of imputation also considers the proportion of components that were imputed. As part of the measures to ensure non-disclosure of individual characteristics, the impact of imputation is only available based on the 25% sample data.
Table 1 below presents the non-response rates of the main income variables for Canada and for each province and territory.
The non-response rates were the same for total income, market income, employment income and government transfers (7.6% for Canada). This was because the information for most of the components of these variables was available directly from T1 filings, tax slips or CRA-administered government programs. Insofar as the census respondent’s information could be linked to a tax-filer or non-tax-filer record (as described in the Collection and processing methods section) administrative data were mostly available to calculate these income variables.
The non-response rates were higher for after-tax income (17.6%) than for total income (7.6%) for Canada. This difference was related exclusively to income taxes. Income tax information was available only when the census respondent was linked to a tax-filer record. When linked to a non-tax-filer record, administrative data were not available to determine income taxes, but were available to calculate total income.
The non-response rates for total income and employment income for 2019 (12.8%) were higher than the rates for 2020 (7.6%) for Canada. This was because there was a higher incidence of census respondents not being linked to a CRA record from 2019. For census respondents younger than 20 years old, non-response rates were higher likely because the respondents only started filing a T1 return or receiving tax slips for 2020. The rates were also higher, but not as high, for other age groups for other reasons, such as immigrating or returning from abroad in 2020.
Across the provinces, the non-response rate for total income varied from 5.8% in Newfoundland and Labrador to 8.6% in British Columbia. It was higher in the territories. In the territories, as well as in remote areas in the provinces, COVID-19 presented some challenges for conducting the Census of Population, including some that affected in-person enumeration such as travel restrictions and unavailability of local staff.
| Regions | Total income in 2020 | Market income in 2020 | Employment income in 2020 | Government transfers in 2020 | After-tax income in 2020 | Total income in 2019 | Employment income in 2019 |
|---|---|---|---|---|---|---|---|
| percent | |||||||
| Canada | 7.6 | 7.6 | 7.6 | 7.6 | 17.6 | 12.8 | 12.8 |
| Newfoundland and Labrador | 5.8 | 5.8 | 5.8 | 5.8 | 14.2 | 9.9 | 9.9 |
| Prince Edward Island | 6.1 | 6.1 | 6.1 | 6.1 | 16.0 | 10.5 | 10.5 |
| Nova Scotia | 6.2 | 6.2 | 6.2 | 6.2 | 16.5 | 10.7 | 10.7 |
| New Brunswick | 6.1 | 6.1 | 6.1 | 6.1 | 14.5 | 10.1 | 10.1 |
| Quebec | 8.3 | 8.3 | 8.3 | 8.3 | 14.7 | 12.1 | 12.1 |
| Ontario | 6.9 | 6.9 | 6.9 | 6.9 | 18.2 | 12.6 | 12.6 |
| Manitoba | 8.2 | 8.2 | 8.2 | 8.2 | 18.9 | 13.9 | 13.9 |
| Saskatchewan | 8.5 | 8.5 | 8.5 | 8.5 | 18.0 | 14.1 | 14.1 |
| Alberta | 8.1 | 8.1 | 8.1 | 8.1 | 19.5 | 14.0 | 14.0 |
| British Columbia | 8.6 | 8.6 | 8.6 | 8.6 | 19.2 | 13.8 | 13.8 |
| Yukon | 13.5 | 13.5 | 13.5 | 13.5 | 27.6 | 17.3 | 17.3 |
| Northwest Territories | 15.7 | 15.7 | 15.7 | 15.7 | 28.8 | 20.0 | 20.0 |
| Nunavut | 31.6 | 31.6 | 31.6 | 31.6 | 45.2 | 37.6 | 37.6 |
| Source: Statistics Canada, Census of Population, 2021. | |||||||
The non-response rate and the impact of imputation for the main income variables are also available at lower levels of geography in 2021 Census data tables presenting data quality indicators. This information is scheduled for release on August 17, 2022, for short-form questions and on November 30, 2022, for long-form questions.
The 2021 Census Data Quality Guidelines, Statistics Canada Catalogue no. 98-26-0006, provide all the information required to understand and interpret the data quality indicators for the 2021 Census, along with guidelines to enable their proper usage. Data quality indicators are provided so that users are informed about the quality of the statistical information and can determine the relevance and the limitations of the data relative to their needs. In general, the quality of the 2021 Census of Population data is very good, but in some cases, data have to be used with caution. It is strongly recommended that users consult all available data quality indicators to get a better sense of the quality of the data products they are interested in.
Certification of final counts
Once data editing and imputation were completed, the data were tabulated to represent the total Canadian population. Certification of the final counts was the last step in the validation process, which led to the recommendation to release the data for each level of geography and domain of interest. Based on the analysis of the data quality indicators and the comparison of the census counts with other data sources, the recommendation is for unconditional release, conditional release, or non-release (for quality reasons on rare occasions). For conditional release or non-release, appropriate notes and warnings are included in the products and provided to users. Moreover, other data sources were used to evaluate the census counts. However, since the risk of error often increases for lower levels of geography and for smaller populations, and the data sources used to evaluate these counts are less reliable or not available at these lower levels, it can be difficult to certify the counts at these levels.
Census counts are also subject to confidentiality rules that ensure non-disclosure of respondent identity and characteristics. For more information on privacy and confidentiality, please refer to Chapter 1 of the Guide to the Census of Population, 2021, Statistics Canada Catalogue no. 98-304-X. For information on how Statistics Canada balances the protection of confidentiality and the need for disaggregated census data, with specific attention to new 2021 Census content, please refer to Balancing the Protection of Confidentiality with the Needs for Disaggregated Census Data, Census of Population, 2021, Statistics Canada Catalogue no. 98-26-0005.
Linkage to administrative records—private households
The success of tax record linkage is the prerequisite for having reliable statistics on income. As mentioned in the Collection and processing methods section, census respondent information could be linked to two types of CRA records: (1) tax-filers, for whom complete income information would be available from T1 filings, tax slips and CRA-administered government programs, and (2) non-tax-filers, for whom only information from tax slips and CRA-administered government programs would be available. Together, tax-filer and non-tax-filer records convey the overall CRA linkage level or rate, while the tax-filer records alone state the T1 linkage level or rate.
In 2021, 92.4% of the population 15 years and older, in private households, was linked to an administrative record from the CRA. More specifically, 82.4% of the population was linked to a tax-filer record and 9.9% was linked to non-tax-filer records. In contrast, in 2016, 85.2% of the population was linked to a tax-filer record and 9.6% was linked to non-tax-filer records for a total of 94.8% of the population being linked to an administrative record from the CRA. For 2016 and 2021, the percentage of the population linked to a tax-filer record was higher than in 2006, when it was 73.4%.Note 1
T1 linkage rates varied more geographically than CRA linkage rates. Among the provinces, Alberta (80.5%), British Columbia (80.8%) and Manitoba (81.1%) had the lowest T1 linkage rates. Newfoundland and Labrador had the highest T1 linkage rate, at 85.8%. The T1 linkage rates in the three territories were all below the national level: 54.8% in Nunavut, 71.2% in Northwest Territories and 72.4% in Yukon. When tax filers and non-tax filers were considered, the linkage rate increased substantially. Between 91% and 94% of the population in each province was linked to a CRA record. The lowest CRA linkage rate for the territories was 68.4% in Nunavut. In most provinces and Yukon, roughly one-third of the records that were not linked to any CRA record were from non-responding households and two-thirds were from unlinked individuals in responding households. The proportion was different in Saskatchewan, Northwest Territories and Nunavut where about half to two-thirds were from non-responding households.
CRA linkage rates across the provinces and territories were lower in 2021 compared with 2016 by about one to four percentage points—except in Nunavut where the CRA linkage rate was lower by 17 percentage points. This lower linkage rate in Nunavut was associated with a lower response rate. In 2016, census enumerators collected data in person in First Nations communities, Métis settlements, Inuit regions and other remote areas. In 2021, the COVID-19 pandemic presented challenges in conducting the Census of Population, including in-person enumeration because of travel restrictions and the unavailability of local staff.
People living in First Nations communities, Métis settlements, Inuit regions and other remote areas who were enumerated using the 2A-R questionnaire had lower T1 (51.5%) and CRA (66.9%) linkage rates. Moreover, these rates were lower compared with 2016 (63.9% T1 linkage rate and 82.2% CRA linkage rate). The lower linkage rates were again associated with lower response rates.
There were some variations in linkage rates among different population groups. For instance, women had higher T1 linkage rates than men, but similar CRA linkage rates. While the CRA linkage rates were quite uniform across age groups, ranging from 88.5% to 93.5%, the T1 linkage rates increased with age. The most notable was the low T1 linkage rate among the 15-to-19 age group (42.0%). In contrast, the T1 linkage rate was 78.3% for the 20-to-24 age group. The T1 linkage rate for those 65 years and older was 90.6%. The differences in T1 linkage rates are related to different filing rates among different population groups.
| Regions | Tax record linkage rate (%) | ||||
|---|---|---|---|---|---|
| 2006 Census (long-form)Table 2 Note 1 | 2016 Census (short-form) T1 recordTable 2 Note 2 | 2016 Census (short-form) CRA recordTable 2 Note 3 | 2021 Census (short-form) T1 recordTable 2 Note 2 | 2021 Census (short-form) CRA recordTable 2 Note 3 | |
| Canada | 73.4 | 85.2 | 94.8 | 82.4 | 92.4 |
| Newfoundland and Labrador | 77.7 | 88.2 | 95.4 | 85.8 | 94.2 |
| Prince Edward Island | 76.8 | 87.0 | 95.2 | 84.0 | 93.9 |
| Nova Scotia | 75.6 | 85.7 | 95.1 | 83.5 | 93.8 |
| New Brunswick | 77.1 | 87.9 | 95.6 | 85.5 | 93.9 |
| Quebec | 76.6 | 89.7 | 96.1 | 85.3 | 91.7 |
| Ontario | 71.8 | 83.8 | 95.0 | 81.8 | 93.1 |
| Manitoba | 74.1 | 84.9 | 95.1 | 81.1 | 91.8 |
| Saskatchewan | 75.3 | 85.2 | 94.4 | 82.0 | 91.5 |
| Alberta | 74.2 | 82.4 | 93.8 | 80.5 | 91.9 |
| British Columbia | 69.8 | 82.9 | 93.1 | 80.8 | 91.4 |
| Yukon | 47.9 | 77.8 | 90.6 | 72.4 | 86.5 |
| Northwest Territories | 35.2 | 76.2 | 87.8 | 71.2 | 84.3 |
| Nunavut | 8.2 | 71.5 | 85.7 | 54.8 | 68.4 |
|
CRA = Canada Revenue Agency
T1 = T1 Income tax and benefit return
|
|||||
Linkage to administrative records—collective households
Because of the differences in collection methodology, the amount of identity-related information collected from different types of households varied. In general, the data required for establishing administrative links were less available in some types of collective households. As a result, collective households had lower T1 (58.3%) and CRA (66.3%) linkage rates than private households overall.
The T1 and CRA linkage rates were also mixed among the different types of collective dwellings. Close to two-thirds of the population aged 15 years and older living in collective dwellings were in nursing homes or residences for senior citizens. The T1 and CRA linkage rates among people living in these two types of facilities were 68.5% and 72.2%. The T1 and CRA linkage rates for other types of collective dwellings as a group were 39.8% and 55.5%. Service collective dwellings, which included lodging and rooming houses, hotels, motels, campgrounds and parks, school residences and training centre residences, and other establishments with temporary accommodation services, had some of the lowest linkage rates. Collectively, their T1 and CRA linkage rates were 10.3% and 14.0%, respectively.
The lower linkage rates and different population composition, compared with private households, could potentially have an impact on the data quality of the income estimates for individuals living in some collective households. As such, income estimates for collective dwellings are not available in standard products but are available as custom tabulations only.
CRA linkage rates among collective dwellings were lower in 2021 (66.3%) compared with 2016 (77.4%). In 2016, census enumerators typically visited collective dwellings to collect information. In 2021, similar to other areas that previously used in-person enumeration, adjustments were made to mitigate the risks of the COVID-19 pandemic, and far fewer collectives were visited in person. Most types of collective dwellings had a decrease in the CRA linkage rate. An exception occurred with correctional and custodial facilities where enumeration using administrative data from the Canadian Correctional Services Survey led to a CRA linkage rate of 89.2% in 2021 compared with 72.5% in 2016.
| Type of collective dwelling | Population 15 years and older | Tax record linkage rate (%) | |
|---|---|---|---|
| Census T1 recordTable 3 Note 2 | Census CRA recordTable 3 Note 3 | ||
| Total | 638,985 | 58.3 | 66.3 |
| Hospitals | 11,015 | 63.1 | 71.7 |
| Residential care facilities such as group homes for persons with disabilities and addictions | 59,485 | 65.3 | 74.6 |
| Nursing homes and residences for seniors | 412,450 | 68.5 | 72.2 |
| Correctional and custodial facilities | 32,755 | 22.9 | 89.2 |
| Shelters | 11,025 | 27.3 | 48.5 |
| Service collective dwellingsTable 3 Note 1 | 65,700 | 10.3 | 14.0 |
| Religious establishments | 8,565 | 68.3 | 80.9 |
| Hutterite colonies | 26,175 | 81.2 | 86.1 |
| OthersTable 3 Note 4 | 11,815 | 1.0 | 1.5 |
|
CRA = Canada Revenue Agency
T1 = T1 Income tax and benefit return
|
|||
Impact of edit and imputation
With the availability of CRA administrative data, most income variables could be compiled with confidence. This is particularly true for respondents who could be linked to tax-filer records as they would have the most complete set of administrative income data. For those who could be linked to a non-tax-filer record, some income fields could be taken from CRA records directly. Other fields required some imputation based on demographic characteristics and correlated auxiliary data from the CRA. Table 4 summarizes the methods through which income components and income taxes were compiled for the linked respondents. For those who could not be linked to any CRA records, the entire income record was imputed based on demographic characteristics.
| Income components and income taxes | Tax filers | Non-tax filers |
|---|---|---|
| Wages, salaries and commissions | A | A/I |
| Net farm income | A | I |
| Net non-farm self-employment income | A | I |
| Investment income | A | I |
| Private retirement income | A | I |
| Market income not included elsewhere | A | A/I |
| Old Age Security pension | A | A |
| Guaranteed Income Supplement | A | A |
| Canada/Quebec Pension Plan—Retirement benefits | A | A |
| Canada/Quebec Pension Plan—Disability benefits | A | A |
| Canada/Quebec Pension Plan—Survivor benefits | A | A |
| Employment Insurance—Regular benefits | A | A |
| Employment Insurance—Other benefits | A | A |
| Federal child benefits | A | A |
| Provincial and territorial child benefits | D | D |
| Social assistance benefits | A | A |
| Workers' compensation benefits | A | A |
| Canada workers benefit | A | A |
| Goods and Services Tax credit and Harmonized Sales Tax credit | A | A |
| Government transfers not included elsewhere | A/D | A/D/I |
| Net federal tax | A | I |
| Provincial and territorial income taxes | A/D Table 4 Note 1 | I |
|
A = Compiled directly from administrative tax records
D = Derived based on program specifications I = Imputed using related auxiliary administrative data and demographic characteristics
|
||
Table 5 gives the percentage change in the number of income recipients, the aggregate amount received from different income sources and the average amount received before and after edit and imputation for the 2006, 2016 and 2021 censuses. The change in aggregate amount presented in Table 5 was generally higher than the impact of imputation presented in Table 11. The main difference is that the impact of deterministic edits and the imputation of complete non-respondents are part of the examination in this section.
With the T1 and CRA linkage rates in the 2021 Census, more imputation was required for income compared with the 2016 Census. However, it was less than in the 2006 Census. In the 2021 Census, the number of total income recipients increased by 9.5% during edit and imputation. The aggregate amount of total income in the file increased by 8.2%. Average total income decreased marginally by 1.2% or $662.

Wages and salaries, which represented close to 63% of the aggregated total income and was an income source present for about two-thirds of the income target population, saw a smaller increase of 8.9% in the number of recipients and a 7.8% increase in aggregate amount. This was made possible because the T4 slips identified 1.32 million more people with wages and salaries on top of the T1 record (6.8% of the total number of recipients), representing 5.6% of the aggregate amount of wages and salaries. Of the 1,583,000 records imputed with wages and salaries, about 33% were from non-responding households, and 67% were from respondents who could not be linked to CRA records.
Similar to past censuses, the change during imputation in the number of recipients and in the aggregate amount for net non-farm self-employment income was higher when compared with the magnitudes observed for other income sources. This stems mainly from the relative absence of information to guide imputation in the absence of a tax return as no corresponding slips are issued by external entities. The distribution in imputed amounts thus corresponds roughly to the distribution in the tax filers.
The extent to which child benefits and other government transfers were imputed reduced tremendously in 2016 and 2021 compared with the past. This happened because some of the key components of these two sources were drawn from the child benefits and the GST and HST credit files from the CRA instead of being derived deterministically.
The magnitude of imputation for other government transfers in 2021 appeared low compared with past censuses because most COVID-19 government income support and benefits were included in other government transfers. They represent about 75% of the people with other government transfers and 69% of the aggregate amount. For a large majority of the COVID-19 benefits and supports (in particular the federal benefits and supports), information was directly compiled from CRA records.
The impact of edit and imputation on other government transfers excluding components related to COVID-19 was similar to the impact in the 2016 Census cycle.
Income taxes also showed less imputation compared with previous cycles. This smaller impact was a result of a change in the calculation of the impact of edit and imputation and not because of a change in the way the income taxes were compiled. In the current and previous census cycles, the provincial income tax for residents living in Quebec had to be imputed deterministically because Quebec’s provincial income tax is administered independently and the income tax amounts were not available even when respondents could be linked to a CRA tax-filer record. For the 2021 Census cycle, Quebec respondents linked to a tax-filer record were not counted as imputations. This approach was more consistent with the imputation flags developed for other subject matter in the 2021 Census.
Comparability over time
As described in the Concepts over time section, income concepts are reviewed and updated to ensure the concept stays current based on the evolution of society and databases.
Comparisons of income information across census cycles are expected to be different to reflect changes in the concept and the income trends. To demonstrate comparability over time and to understand where care should be exercised when evaluating trends for particular detailed sources, it is best to compare the trends across different data sources.
The main income trends from the census were in line with other data sources. More information on the comparison over time is included in the next section.
Comparability with other data sources
As with all data sources produced by Statistics Canada, the quality of the released 2021 Census income information was evaluated internally prior to publication. As part of this evaluation, the income data were compared, to the extent possible, with other data sources. Many factors affect comparisons of income data across these data sources. Among other factors, comparability is affected by differences in target populations, reference periods, sampling and collection methods, and approaches to data processing.
The main sources of data for comparison were the income estimates from the Canadian Income Survey (CIS) (2015 and 2020) and a variety of income files held by Statistics Canada derived from data obtained from the CRA. The various income files are herein referred to as the income file. More information about this income file is available in the microdata linkage description for the Administrative Personal Income Masterfile located on the Statistics Canada 2017 submissions web page.
For evaluation purposes, the 2021 Census estimates were also compared with those from the 2016 Census.
The 2021 Census and the income file used information from T1 files, tax slips and CRA benefit records to compile and derive income, while the CIS drew its income information primarily from T1 files only.
All of the above sources have different coverage levels as they are produced with different methods. For example, the CIS estimates reflect adjustments made for the population net undercoverage, while the estimates from the census and the income file do not include such adjustments.
The 2021 Census income tables target all individuals in private households who usually lived in Canada. It included individuals who lived on reserves and settlements, permanent residents and non-permanent residents, such as refugee claimants, holders of work or study permits and members of their family living with them. In the CIS, residents of Yukon, Northwest Territories and Nunavut, as well as those living on reserves, were excluded.
As in the CIS, the census income tables also excluded those living in institutional collective dwellings such as hospitals, nursing homes and penitentiaries; Canadian citizens living in other countries; full-time members of the Canadian Forces stationed outside of Canada and foreign residents.Note 2
For the income file, because of its administrative nature and the limited information available on dwelling type, none of the above exclusions apply.
Given the sensitivity of most income indicators to such methodological differences, users should use caution when comparing 2021 Census income estimates with household income surveys, administrative data or earlier census data. The results of some comparison exercises are presented below.
In addition, because the CIS is a sample survey, the estimates have sampling variability. Comparisons made with estimates based on a single year in the CIS may be different than comparisons made with longer-term trends observed across several years of data.
Individual income by source
The key statistics between the census and the comparison sources (CIS and income file) were mostly comparable.
| Source | Census | CIS | Income file | Census | CIS | Income file | Census | CIS | Income file |
|---|---|---|---|---|---|---|---|---|---|
| 2015 median ($) | 2020 median ($) | % change (2015 to 2020) | |||||||
| Total income | 36,994 | 35,759 | 34,747 | 41,054 | 39,527 | 38,764 | 11.0 | 10.5 | 11.6 |
| Employment income | 36,424 | 35,994 | 35,371 | 37,358 | 36,101 | 35,972 | 2.6 | 0.3 | 1.7 |
| Wages, salaries and commissions | 38,466 | 37,659 | 37,214 | 39,991 | 38,911 | 38,204 | 4.0 | 3.3 | 2.7 |
| Net self-employment income | 7,263 | 8,170 | 7,142 | 4,495 | 4,666 | 4,183 | -38.1 | -42.9 | -41.4 |
| Investment income | 837 | 812 | 882 | 623 | 634 | 626 | -25.6 | -21.9 | -29.0 |
| Private retirement income | 17,687 | 17,334 | 16,599 | 18,208 | 18,400 | 17,058 | 2.9 | 6.1 | 2.8 |
| Market income not included elsewhere | 1,589 | 1,094 | 1,329 | 1,750 | 1,540 | 1,814 | 10.1 | 40.8 | 36.5 |
| Government transfers | 5,920 | 5,560 | 5,596 | 9,766 | 9,897 | 10,017 | 65.0 | 78.0 | 79.0 |
| Old Age Security pension and Guaranteed Income Supplement | 7,343 | 7,343 | 7,345 | 7,664 | 7,664 | 7,664 | 4.4 | 4.4 | 4.3 |
| Canada Pension Plan and Quebec Pension Plan benefits | 8,032 | 8,058 | 7,893 | 8,147 | 8,265 | 8,035 | 1.4 | 2.6 | 1.8 |
| Employment Insurance benefits | 6,075 | 6,117 | 6,140 | 5,730 | 5,500 | 5,730 | -5.7 | -10.1 | -6.7 |
| Child benefits | 4,155 | 2,884 | 4,158 | 5,854 | 5,285 | 6,013 | 40.9 | 83.3 | 44.6 |
| Other income from government sources | 675 | 834 | 708 | 1,966 | 2,148 | 1,991 | 191.3 | 157.6 | 181.2 |
| Income taxes | 6,824 | 6,502 | 6,605 | 6,558 | 6,057 | 6,171 | -3.9 | -6.8 | -6.6 |
| After-tax income | 33,383 | 32,594 | 31,801 | 36,970 | 35,836 | 35,209 | 10.7 | 9.9 | 10.7 |
|
CIS = Canadian Income Survey Note: Dollar values are presented in 2020 constant dollars. Sources: Statistics Canada, Census of Population, 2016 and 2021; Canadian Income Survey, 2015 and 2020; and a variety of income files held by Statistics Canada derived from data obtained from the Canada Revenue Agency, 2015 and 2020. |
|||||||||
In terms of total income, the census had fewer recipients than the CIS (3.8%) and the income file (7.2%) in 2020; the aggregate sum was also 1.8% higher than the CIS and 3.2% lower than the income file. These minor differences were expected because of the different target populations described above. Median and average total income amounts were also higher; the census estimates were about 4% to 6% higher than estimates from the other two sources. According to the data sources, all of the aforementioned indicators showed very similar growth patterns between 2015 and 2020. For instance, the census reported an 11.0% growth in median, while the CIS showed a 10.5% growth, and the income file showed an 11.6% growth.
As for employment income, the census also had fewer recipients than the CIS (1.9%) and the income file (3.6%). Similar to what was observed in total income, the aggregate sum was 3.7% higher than the CIS and 1.2% lower than the income file. The median and average employment income from the census were about 2% to 5% higher than the other two sources in 2020. The median employment income growth between 2015 and 2020 was 2.6% for the census, compared with 0.3% for the CIS and 1.7% for the income file.
Statistics on some other income sources may present more differences between the census and the other two sources. The differences may be attributable to issues that can be classified in three broad categories: coverage issues, processing differences and changes related to CRA forms and slips.
Coverage issues
In standard tables, the census shows fewer individuals with benefits from the Old Age Security program and from the Canada and Quebec Pension Plans than the income file, mainly because of differences in coverage. The income file captured the population eligible for these benefits during year 2020, including people living in collective dwellings such as residences for senior citizens and nursing homes. The published census data only covered those still living in private households in May 2021. When those living in collective dwellings were included, the number of recipients and the aggregate amounts were much closer between the two data sources. Conversely, the median amounts were essentially the same between the other sources and the census in 2020 regardless of any coverage adjustments.
The census also shows fewer people with certain types of other government transfers compared with the income file. This was particularly true for social assistance and certain benefits related to COVID-19—including the CRB, the CRCB, the CRSB, enhancements to Old Age Security and Guaranteed Income Supplement and benefits to individuals with disabilities—where the estimated number of recipients and the aggregate amount were about 14% to 29% lower than the estimate from the income file.
The CERB estimates, which represent the largest portion of benefits related to COVID-19, were lower in the census than in the income file by about 10% for the count of recipients and the aggregate sum. The only benefit related to COVID-19 where the census had a higher count of recipients and aggregate sum (by about 4%) occurred with the CESB. The median amounts for social assistance and the benefits related to COVID-19 were essentially the same between the census and the income file. The means were within five percentage points.
These differences are related to the coverage differences described at the start of this section. In addition, as shown in a previous census coverage report (Coverage Technical Report, Census of Population, 2016 Statistics Canada, Catalogue no. 98-303-X) there is a lower propensity among certain groups, such as men and 18- to 34-year-olds, to respond to the census. Some of the people in these groups also tended to be recipients of certain benefits related to COVID-19.
Processing differences
Three areas showed slightly different figures mainly because of the ways in which the data are processed. Some incongruities in the estimates for net self-employment and retirement income between the census and the income file can be largely attributed to a different processing strategy of non-tax filers. Some differences in child benefit estimates between the census and the CIS can be attributed to different derivation methods.
There is little information about net self-employment income for non-tax filers as no corresponding slips are issued by external entities. As shown in the Impact of edit and imputation section, the census imputed just under one-fifth of the recipients of self-employment income. Estimates from the income file did not include imputation for non-tax filers because of an absence of additional information. Thus, the net self-employment income estimates were higher in the census compared with the income file. The count of recipients with net self-employment income was 4.6% higher; the aggregate amount was 11.1% higher; the median was 7.5% higher.
Different processing of non-tax filers was also a source of difference for private retirement income. For private retirement income on the income file, amounts were derived directly from CRA slips for non-tax filers, whereas the census used the CRA slips to impute an amount for non-tax filers that might include additional amounts not shown on slips. The median amount in the census was 6.7% higher than the median from the income file. The counts of recipients and aggregate sum were lower by 6.7% and 2.6%, respectively, in the census compared with the income file, and these differences relate to the coverage differences mentioned earlier.
Estimates of child benefits were higher in the census than the CIS. The census and the income file derive child benefits directly from CRA records. The CIS derived child benefits based on the eligibility criteria and the reported characteristics of the family. The median child benefit from the census was 10.8% higher than the median from the CIS. The estimates were closer between the census and the income file, which both derive the amount from CRA records.
Changes related to Canada Revenue Agency forms and slips
Changes related to the CRA forms and slips can affect comparability to past estimates as most of the income information was compiled directly from CRA administrative data. Overall, the estimates for 2015 and 2020 were comparable and the three sources had similar changes over the period. Nevertheless, changes to the CRA forms, slips and reporting patterns can have an impact when looking at groups or areas directly related to the change. Three changes to the CRA forms, slips or related reporting patterns were identified in the review of the income estimates between 2015 and 2020.
First, in 2020, there was a large increase in the number of T5 slips issued for amounts less than $50 in Quebec. The T5 slips are issued for certain types of investment income, including bank interest. However, financial institutions are not required to issue T5 slips for amounts less than $50. The observed increase in the issuance of T5 slips was likely because of a change at some financial institutions as opposed to a real change in the number of recipients of this type of income. As a result of this change, the census estimates showed an increase in the number of people in Quebec with investment income and a decrease in the median from 2015 to 2020. When looking at people with at least $100 of investment income in Quebec, the number of people and the median amount are similar for 2015 and 2020.
Second, starting in 2018, T5007 slips were issued to recipients of subsidized senior’s bus passes for the amount of the subsidy (just under $600) in British Columbia. These amounts on the T5007 slip are compiled into the estimates for social assistance. As a result of this change, the census estimates showed an increase in the number of people in British Columbia with social assistance transfers and a decrease in the median from 2015 to 2020. The bus pass subsidy was also in existence in 2015, but the amount of the subsidy was below the threshold where slips are issued.
In both of these situations, the aggregate sum was not largely affected as the amounts were small. Moreover, it is possible to adjust for these changes when making comparisons over time by excluding the small amounts when deriving statistics. In addition, these changes affect not only the census estimates but also the estimates from the other sources.
Third, starting in 2019, a new CRA form (Form T90) was introduced for people receiving exempt income under the Indian Act. This exempt income is included in Statistics Canada’s income concepts. This new form is completed and submitted by the tax filer and new fields are available for processing. This provided another source of administrative data in addition to information available on tax slips or, previously, on the T1 form. The existence of this new form may also affect tax-filing behaviours. In addition, a certain amount of misclassification of income may occur because people may be regularly including some types of income, such as social assistance income or investment income, in the “other income” field instead of in the appropriate field of the T90 form. As a result, these changes may contribute to differences when making historical comparisons in areas where this exempt income is found (predominantly on reserves).
Regional aspects
The 2020 employment income and the 2020 total income estimates from the census and the income file for provinces and territories had differences similar to those at the national level described above. To elaborate, the number of recipients with the income and the aggregate amounts were lower in the census compared with the income file, and the medians were higher. These differences were expected because of the many factors mentioned above that affect comparisons between sources.
The territories had larger discrepancies between the census and the income file than the provinces. For example, the census estimates for the number of recipients of employment income were lower than the income file estimate by 6.5% to 12.8% among the three territories and by 1.1% to 6.1% among the ten provinces. Closer examination showed that the additional differences might stem from the territories having a larger portion of people whose usual place of residence was outside the region, such as workers that permanently reside elsewhere. Because of the timing difference in data collection and conceptual differences in the place of residence between the census and the administrative data, some of these people were counted in the territory on the income file while being enumerated outside of the territory in the census.
In summary, the main income trends from the census were in line with the CIS and the income file between 2015 and 2020. As described above, care should be exercised when evaluating trends for particular detailed sources, such as market income not included elsewhere or investment income, because of changes to the data sources and derivation method employed.
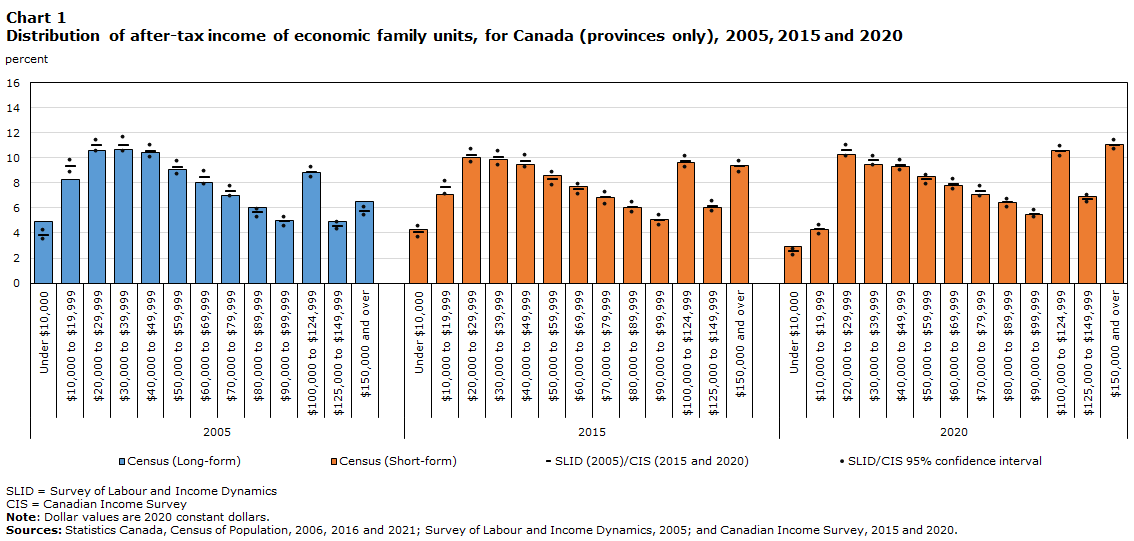
Economic family income distribution
In terms of economic family after-tax income distributions, the 2015 and 2020 distributions overall demonstrated close agreement across data sources—both were closer than the 2005 distributions.
Compared with the CIS, the census estimated relatively more economic families and people not in economic families (together they will be called economic family units) at both ends of the distribution. The differences at the lower end of the income distribution, however, were less pronounced in 2015 and 2020 than in 2005 when the Survey of Labour and Income Dynamics (SLID) was the comparator.
Data table for Chart 1
| Income groups | 2005 | 2015 | 2020 | |||||||||
|---|---|---|---|---|---|---|---|---|---|---|---|---|
| Census (long-form) | SLID | SLID lower limit of the 95% confidence interval | SLID upper limit of the 95% confidence interval | Census (short-form) | CIS | CIS lower limit of the 95% confidence interval | CIS upper limit of the 95% confidence interval | Census (short-form) | CIS | CIS lower limit of the 95% confidence interval | CIS upper limit of the 95% confidence interval | |
| percent | ||||||||||||
| Under $10,000 | 4.9 | 3.8 | 3.5 | 4.2 | 4.3 | 4.0 | 3.6 | 4.5 | 2.9 | 2.5 | 2.2 | 2.7 |
| $10,000 to $19,999 | 8.3 | 9.3 | 8.8 | 9.8 | 7.1 | 7.6 | 7.1 | 8.1 | 4.3 | 4.3 | 3.9 | 4.6 |
| $20,000 to $29,999 | 10.6 | 11.0 | 10.5 | 11.4 | 10.0 | 10.2 | 9.6 | 10.7 | 10.3 | 10.6 | 10.1 | 11.0 |
| $30,000 to $39,999 | 10.7 | 11.0 | 10.5 | 11.6 | 9.9 | 10.0 | 9.4 | 10.5 | 9.5 | 9.8 | 9.4 | 10.1 |
| $40,000 to $49,999 | 10.4 | 10.5 | 10.0 | 11.0 | 9.5 | 9.7 | 9.2 | 10.2 | 9.3 | 9.4 | 9.0 | 9.8 |
| $50,000 to $59,999 | 9.1 | 9.2 | 8.7 | 9.7 | 8.6 | 8.3 | 7.8 | 8.8 | 8.5 | 8.3 | 7.9 | 8.6 |
| $60,000 to $69,999 | 8.0 | 8.4 | 7.9 | 8.9 | 7.7 | 7.5 | 7.1 | 7.9 | 7.8 | 7.9 | 7.5 | 8.3 |
| $70,000 to $79,999 | 7.0 | 7.3 | 6.9 | 7.7 | 6.8 | 6.8 | 6.3 | 7.2 | 7.1 | 7.3 | 6.9 | 7.7 |
| $80,000 to $89,999 | 6.0 | 5.6 | 5.2 | 5.9 | 6.0 | 6.0 | 5.6 | 6.4 | 6.4 | 6.4 | 6.0 | 6.7 |
| $90,000 to $99,999 | 5.0 | 4.9 | 4.5 | 5.2 | 5.1 | 5.0 | 4.6 | 5.4 | 5.5 | 5.5 | 5.2 | 5.8 |
| $100,000 to $124,999 | 8.8 | 8.8 | 8.4 | 9.2 | 9.6 | 9.7 | 9.2 | 10.1 | 10.6 | 10.5 | 10.1 | 10.9 |
| $125,000 to $149,999 | 4.9 | 4.5 | 4.3 | 4.8 | 6.0 | 6.1 | 5.7 | 6.5 | 6.9 | 6.7 | 6.4 | 7.0 |
| $150,000 and over | 6.5 | 5.7 | 5.4 | 6.0 | 9.4 | 9.3 | 8.8 | 9.7 | 11.1 | 11.0 | 10.7 | 11.4 |
|
SLID = Survey of Labour and Income Dynamics CIS = Canadian Income Survey Note: Dollar values are 2020 constant dollars. Sources: Statistics Canada, Census of Population, 2006, 2016 and 2021; Survey of Labour and Income Dynamics, 2005; and Canadian Income Survey, 2015 and 2020. |
||||||||||||
Low income
The low-income measure (LIM) is an internationally used measure of low income. The concept underlying the LIM is that a household has low income if its income is less than half of the median income of all households. The LIM income threshold is the same for a household, regardless of where they live in Canada, and is derived from the private households present in the census.
Low-income rates for Canada based on the low-income measure, after-tax (LIM-AT) was 11.1% in the 2021 Census. The calculation of this rate includes the population in territories and on reserves. This was not the case in past censuses and the CIS for 2020 and before.
In order to present more conceptually consistent comparisons, Table 7 presents the low-income rates for the off-reserve population in the provinces for the 2021 Census and other sources.
The low-income rate for Canada (provinces only and excluding reserves) was 10.9%. That prevalence rate when estimated by the 2020 CIS was lower (9.3%). The 2020 low-income rates from the CIS were lower than the rates from the census for all provinces. The biggest gap was observed in Newfoundland and Labrador where the census reported a low-income rate of 15.2% and the CIS reported a low-income rate of 11.9%.
In 2015, the overall low-income rates for Canada were almost identical from the census (14.2%) and the CIS (14.3%). However, in 2005, the estimate from SLID (13.0%) was lower than the estimate from the census (14.0%).
Despite the difference in the 2020 low-income rates between the CIS and the census, both sources showed a substantial decrease from 2015 in every province.
The differences in the low-income rate between the CIS and the census are caused by many of the same reasons that caused differences in the other income estimates, including differences in target populations, reference periods, sampling and collection methods and approaches to data processing.
| Geography | 2005 | 2015 | 2020 | |||
|---|---|---|---|---|---|---|
| Census | SLID | Census | CIS | Census | CIS | |
| percent | ||||||
| Canada (including territories and reserves) | Note ...: not applicable | Note ...: not applicable | 15.7 | Note ...: not applicable | 11.1 | Note ...: not applicable |
| Canada (provinces only)Table 7 Note 1 | 14.0 | 13.0 | 14.2 | 14.3 | 10.9 | 9.3 |
| Newfoundland and LabradorTable 7 Note 1 | 20.0 | 19.1 | 15.4 | 15.9 | 15.2 | 11.9 |
| Prince Edward IslandTable 7 Note 1 | 15.5 | 11.2 | 16.9 | 16.8 | 13.7 | 13.0 |
| Nova ScotiaTable 7 Note 1 | 17.2 | 14.8 | 17.2 | 17.3 | 14.7 | 12.0 |
| New BrunswickTable 7 Note 1 | 17.2 | 17.5 | 17.1 | 17.1 | 14.1 | 13.1 |
| QuebecTable 7 Note 1 | 15.3 | 14.1 | 14.6 | 16.1 | 11.9 | 10.1 |
| OntarioTable 7 Note 1 | 12.9 | 11.7 | 14.4 | 14.2 | 10.0 | 9.0 |
| ManitobaTable 7 Note 1 | 15.7 | 14.7 | 15.4 | 16.0 | 12.9 | 11.4 |
| SaskatchewanTable 7 Note 1 | 16.8 | 17.8 | 12.8 | 12.4 | 12.0 | 9.6 |
| AlbertaTable 7 Note 1 | 9.8 | 8.7 | 9.3 | 6.9 | 8.9 | 6.4 |
| British ColumbiaTable 7 Note 1 | 15.4 | 14.8 | 15.5 | 16.6 | 10.6 | 8.9 |
|
... not applicable SLID = Survey of Labour and Income Dynamics CIS = Canadian Income Survey
|
||||||
High income
The comparison of the 2021 Census data with administrative sources for high-income individuals is similar to such comparisons with income data from the 2016 Census.
The 2021 Census estimated 19,400 more individuals with a total income of $100,000 and over in 2020 than the income file, corresponding to a difference of 0.6% between the estimates.
Overall, the census and the income file presented similar growth trajectories between 2015 and 2020 for high-income individuals with the census showing a 12.1% increase among individuals with $100,000 and over and the income file showing a 12.9% increase for this group.
While the 2021 Census and the income file presented virtually the same number of individuals in the $300,000 and over range, the census has progressively lower coverage rates compared with the income file as incomes increase. For example, the census showed about 3.0%, or 2,160, fewer people with total incomes of $500,000 and over compared with the income file estimate, but 6.0% less in the $1,000,000 and over income range (1,160 individuals).
| Total income group | 2015 | 2020 | Percentage change 2015 to 2020 | |||
|---|---|---|---|---|---|---|
| Census | Income file | Census | Income file | Census | Income file | |
| Population with income | 27,488,530 | 29,129,730 | 29,241,810 | 31,665,810 | 6.4 | 8.7 |
| Income under $100,000 | 24,668,940 | 26,347,685 | 26,081,570 | 28,524,965 | 5.7 | 8.3 |
| Income $100,000 and over | 2,819,590 | 2,782,045 | 3,160,245 | 3,140,845 | 12.1 | 12.9 |
| $200,000 and over | 467,660 | 459,805 | 513,885 | 510,895 | 9.9 | 11.1 |
| $300,000 and over | 193,350 | 191,695 | 199,695 | 200,830 | 3.3 | 4.8 |
| $500,000 and over | 72,830 | 73,660 | 68,805 | 70,965 | -5.5 | -3.7 |
| $1,000,000 and over | 21,975 | 22,785 | 18,235 | 19,395 | -17.0 | -14.9 |
|
Note: Dollar values are 2020 constant dollars. Sources: Statistics Canada, Census of Population, 2016 and 2021; and a variety of income files held by Statistics Canada derived from data obtained from the Canada Revenue Agency, 2015 and 2020. |
||||||
Income sources for the 2019 reference year
As described in the Definitions and concepts section of this guide, a few crucial income sources for the 2019 reference year are available for the 2021 Census of Population to provide baseline information to assess the economic impact of the COVID-19 pandemic. The data for the 2019 variables were appended from the annual income file produced from administrative data.
Estimates of the number of income recipients for the 2019 reference year using the 2021 Census were lower than the estimates using the administrative data for 2019. The coverage difference related to estimates for 2020 that was previously described also apply to comparisons of census-based 2019 estimates versus estimates based on the 2019 income file.
There is another source of difference specific to comparisons of 2019 estimates. Specifically, estimates of 2019 income using the census were for the population on Census Day, which is about 1.4 years after 2019. Population loss from deaths and out-migration during this period would be another source of difference when comparing census estimates with 2019 administrative data. To illustrate this difference, the census estimate for the number of people with employment income in 2020 was 4.0% lower than the estimate from the 2020 income file. For the 2019 reference year, the census estimate was 5.3% lower than the estimate from the 2019 income file.
Despite the additional source of coverage difference, Table 9 shows that both sources have a similar change in the number of income recipients from 2019 to 2020. The increase in the number of recipients of Employment Insurance benefits from 2019 to 2020 was exactly the same (31.2%) for both sources. The decrease in the number of recipients of wages, salaries and commissions was also very similar (1.5% with the census and 2.0% with the income file).
Between the two sources, there was a difference in the change between 2019 and 2020 for recipients of net self-employment income. The census estimate shows an increase of 7.3% while the income file shows a decrease of 1.0%. This is because the 2019 estimates using the census data were appended from the 2019 income file, which does not include imputation for non-tax filers as described in the section on processing differences. If imputations of non-tax filers were excluded from the census estimates for 2020, the change from 2019 to 2020 becomes a decrease of 2.1%, and this is close to what was observed with the income file. Thus, when examining changes in net self-employment income between 2019 and 2020 with the census data, it is recommended to only consider data for the tax filers.
| Source | Census | Income file |
|---|---|---|
| percent | ||
| Total income | 2.2 | 1.2 |
| Market income | 1.3 | -0.4 |
| Employment income | -0.5 | -1.9 |
| Wages, salaries and commissions | -1.5 | -2.0 |
| Net self-employment income | 7.3 | -1.0 |
| Government transfers | 9.5 | 8.6 |
| Employment Insurance benefits | 31.2 | 31.2 |
| After-tax income | 2.2 | 1.2 |
| Sources: Statistics Canada, Census of Population, 2021; and a variety of income files held by Statistics Canada derived from data obtained from the Canada Revenue Agency, 2019 and 2020. | ||
Long-form estimates involving income variables
When the census data analysis involves crossing income data with information from the long-form questionnaire (e.g., analyzing an education variable with an income variable), users must take into consideration certain aspects of the data quality, such as the non-response bias and the variability due to sampling and TNR.
Variability due to sampling and total non-response
The objective of the long-form census questionnaire is to produce estimates on various topics for a wide variety of geographies, ranging from very large areas (such as provinces and census metropolitan areas) to very small areas (such as neighbourhoods and municipalities), and for various populations (such as Indigenous peoples and immigrants). In order to reduce response burden, the long-form census questionnaire is administered to a random sample of households.
This sampling approach and total non-response introduce variability into the estimates that needs to be accounted for. This variability also depends on the population size and the variability of the characteristics being measured. Furthermore, the precision of estimates may vary considerably depending on the domain or geography of interest, in particular because of the variation in response rates. For more information on variability due to sampling and total non-response in long-form census questionnaire estimates, please refer to the Guide to the Census of Population, 2021, Statistics Canada Catalogue no. 98-304-X.
Non-response bias
Non-response bias is a potential source of error for all surveys, including the long-form census questionnaire. Non-response bias arises when the characteristics of those who participate in a survey are different from those who do not.
In general, the risk of non-response bias increases as the response rate declines. For the 2021 long-form census questionnaire, Statistics Canada adapted its collection and estimation procedures to mitigate the effect of non-response bias to the extent possible. For more information on these mitigation strategies, please refer to the Guide to the Census of Population, 2021, Statistics Canada Catalogue no. 98-304-X.
Data quality indicators for long-form income estimates
The confidence interval was selected as a variance-based quality indicator to accompany the 2021 Census of Population long-form estimates because it helps users easily make a statistical inference. This indicator provides a measure of the accuracy of the long-form estimates. Using a science-based approach, research and simulations were done to ensure that confidence intervals are constructed using adequate statistical methods for the Census of Population data and areas of interest.
A confidence interval is associated with a confidence level, generally set at 95%. A 95% confidence interval is an interval constructed around the estimate so that, if the process that generated the sample were repeated many times, the value of the interest parameter in the population would be contained in 95% of these intervals. The confidence interval consists of a lower bound and an upper bound. These two bounds accompany the long-form estimates in most data tables.
Further details on the different methods used to construct confidence intervals and their assumptions are provided in the Sampling and Weighting Technical Report, Census of Population, 2021, Statistics Canada Catalogue no. 98-306-X.
The three data quality indicators available for short-form income content and described in the Data quality indicators section—TNR, non-response rate per question and impact of imputation per question—are also available for long-form income estimates. These indicators are slightly different for long-form content (e.g., weights are used). These differences are described in the 2021 Census Data Quality Guidelines, Statistics Canada Catalogue no. 98-26-0006. A key difference is that the non-response rate per question, when used for long-form content, includes only partial non-response to the question (when answers to certain questions are not available), except for First Nations communities, Métis Settlements, Inuit regions and other remote areas where both partial and total non-response are taken into account.
Table 10 and Table 11 present the non-response and impact of imputation rates for key income concepts when using the 25% sample data. Overall, the non-response rates were similar to those based on the 100% data—except for being slightly lower because it includes only partial non-response to the question (other than in First Nations communities, Métis settlements, Inuit regions and other remote areas where both partial and TNR are taken into account).
The impact of imputation rates, presented in Table 11, was similar to the non-response rates in Table 10 for total income, market income, employment income and government transfers (at around 5% for Canada). In other words, the proportion of the total value of the estimate coming from imputation was similar to the proportion of records where CRA records could not be linked.
For after-tax income, the impact of imputation rates (6.1%) were lower than the non-response rates (15.2%) because imputed values for income taxes were subtracted from total income to produce the after-tax income. Thus, imputation of income taxes did not directly add to the impact of imputation, whereas a non-response for income taxes directly contributed to the non-response rate as it is an important component of the after-tax income concept.
Lastly, the impact of imputation rates for the total income and employment income of 2019 were lower than the non-response rates (about 4.8% versus about 10.3% for Canada). This was because a large portion of the non-responses for the 2019 income variables were likely people who were inactive in the labour market, did not receive benefits or were not in Canada. Often, a value of zero was imputed in these cases. Thus, the proportion of the total value of the estimate coming from imputation was smaller than the proportion of non-response.
| Regions | Total income in 2020 | Market income in 2020 | Employment income in 2020 | Government transfers in 2020 | After-tax income in 2020 | Total income in 2019 | Employment income in 2019 |
|---|---|---|---|---|---|---|---|
| percent | |||||||
| Canada | 5.0 | 5.0 | 5.0 | 5.0 | 15.2 | 10.3 | 10.3 |
| Newfoundland and Labrador | 3.3 | 3.3 | 3.3 | 3.3 | 11.8 | 7.5 | 7.5 |
| Prince Edward Island | 4.0 | 4.0 | 4.0 | 4.0 | 13.9 | 8.3 | 8.3 |
| Nova Scotia | 3.6 | 3.6 | 3.6 | 3.6 | 14.2 | 8.3 | 8.3 |
| New Brunswick | 3.3 | 3.3 | 3.3 | 3.3 | 12.0 | 7.4 | 7.4 |
| Quebec | 6.1 | 6.1 | 6.1 | 6.1 | 12.6 | 10.0 | 10.0 |
| Ontario | 4.4 | 4.4 | 4.4 | 4.4 | 16.1 | 10.3 | 10.3 |
| Manitoba | 5.3 | 5.3 | 5.3 | 5.3 | 16.3 | 11.2 | 11.2 |
| Saskatchewan | 4.9 | 4.9 | 4.9 | 4.9 | 14.7 | 10.7 | 10.7 |
| Alberta | 4.9 | 4.9 | 4.9 | 4.9 | 16.7 | 11.1 | 11.1 |
| British Columbia | 5.5 | 5.5 | 5.5 | 5.5 | 16.5 | 10.9 | 10.9 |
| Yukon | 9.5 | 9.5 | 9.5 | 9.5 | 23.8 | 13.2 | 13.2 |
| Northwest Territories | 14.3 | 14.3 | 14.3 | 14.3 | 28.1 | 18.7 | 18.7 |
| Nunavut | 31.6 | 31.6 | 31.6 | 31.6 | 45.2 | 37.6 | 37.6 |
| Source: Statistics Canada, Census of Population, 2021. | |||||||
| Regions | Total income in 2020 | Market income in 2020 | Employment income in 2020 | Government transfers in 2020 | After-tax income in 2020 | Total income in 2019 | Employment income in 2019 |
|---|---|---|---|---|---|---|---|
| percent | |||||||
| Canada | 5.3 | 5.4 | 5.2 | 4.9 | 6.1 | 4.9 | 4.8 |
| Newfoundland and Labrador | 3.5 | 3.5 | 3.1 | 3.3 | 4.3 | 3.1 | 2.9 |
| Prince Edward Island | 4.4 | 4.6 | 4.5 | 3.7 | 5.1 | 3.9 | 4.0 |
| Nova Scotia | 4.1 | 4.3 | 3.9 | 3.5 | 5.1 | 3.5 | 3.4 |
| New Brunswick | 3.7 | 3.8 | 3.5 | 3.4 | 4.4 | 3.2 | 3.0 |
| Quebec | 5.9 | 6.0 | 6.0 | 5.6 | 6.5 | 5.7 | 5.7 |
| Ontario | 5.0 | 5.1 | 4.8 | 4.3 | 5.9 | 4.5 | 4.4 |
| Manitoba | 5.2 | 5.1 | 4.9 | 5.7 | 6.0 | 4.6 | 4.5 |
| Saskatchewan | 4.7 | 4.5 | 4.3 | 5.4 | 5.2 | 4.1 | 3.9 |
| Alberta | 5.1 | 5.1 | 4.9 | 5.2 | 6.1 | 4.7 | 4.5 |
| British Columbia | 6.0 | 6.0 | 6.0 | 5.5 | 6.7 | 5.4 | 5.4 |
| Yukon | 9.7 | 9.5 | 9.6 | 11.0 | 10.8 | 8.5 | 8.2 |
| Northwest Territories | 13.4 | 12.9 | 12.5 | 17.0 | 15.1 | 12.7 | 12.1 |
| Nunavut | 29.1 | 28.3 | 27.8 | 32.7 | 30.5 | 29.1 | 28.1 |
| Source: Statistics Canada, Census of Population, 2021. | |||||||
The effects of sampling on income estimates
In the 2021 Census, the long-form questions were asked of one in four households living in private dwellings with the exception of First Nations communities, Métis Settlements, Inuit regions and other remote areas where all households received the long-form questionnaire. Initial sampling weights were calibrated to align, where possible, certain long-form estimates to the counts seen in the census short-form questionnaire. However, differences in income estimates remain between the long-form and short-form questionnaires because of the presence of sampling error in long-form estimates. The impact of sampling is generally small for larger populations but grows when the estimates are based on smaller groups or populations with more specific characteristics. Statistics are also subject to more or less variability based on the distribution of the variable in the population,Note 3 the nature of the statistic and whether or not they were used in the calibration steps.Note 4
The Data quality section of the 2016 Census of Population Income Reference Guide (Catalogue no. 98-500-X2016004) describes generally the variability between certain short-form and long-form income estimates. Averages were generally subject to larger sampling errors than medians. Median and average amounts for earnings and total income were often less variable than the same statistics for government transfers. The percentage of individuals with employment income was often less variable than the percentage of individuals with government transfers.
Similar variability between short-form and long-form estimates have also been observed with the 2021 Census income data. For example, for 150 estimates of the median total income of households in areas where there were 50,000 households or more with income, 100% of the estimates had differences of less than 1% between the statistic produced from the short-form data and the one produced from the long-form data. In the case of the average, 95.3% had less than 1% difference between the estimates, 4.0% had between 1% and 2% difference and 0.7% had more than 2% but less than 5% difference.
Market basket measure
Comparison with other sources
As described in the Definitions and concepts section, the market basket measure (MBM) is Canada’s Official Poverty Line. The 2020 MBM poverty rate for Canada was 8.1% in the census (Table 12). The calculation of this rate does not include the population in territoriesNote 5 and on reserves.Note 6
| Geography | 2015 | 2020 | ||
|---|---|---|---|---|
| Census | CIS | Census | CIS | |
| percent | ||||
| Canada (provinces only) | 14.5 | 14.5 | 8.1 | 6.4 |
| Newfoundland and Labrador | 13.1 | 13.0 | 8.2 | 7.0 |
| Prince Edward Island | 16.5 | 15.7 | 8.7 | 7.6 |
| Nova Scotia | 17.6 | 16.8 | 9.8 | 7.7 |
| New Brunswick | 15.6 | 16.2 | 8.1 | 7.6 |
| Quebec | 12.3 | 13.5 | 6.4 | 4.8 |
| Ontario | 15.5 | 15.1 | 8.3 | 6.8 |
| Manitoba | 14.3 | 14.1 | 8.6 | 6.8 |
| Saskatchewan | 12.7 | 12.2 | 8.4 | 6.7 |
| Alberta | 11.4 | 9.4 | 8.1 | 5.5 |
| British Columbia | 17.6 | 18.6 | 9.8 | 7.6 |
|
CIS = Canadian Income Survey Sources: Statistics Canada, Census of Population, 2016 and 2021; and Canadian Income Survey, 2015 and 2020. |
||||
Similar to the situation observed with the LIM-AT, the MBM poverty rate estimated by the 2020 CIS (6.4%) was lower than that seen in the census. The 2020 MBM rates from the CIS were lower than the rates from the census for all provinces. The biggest discrepancy was observed in Alberta, where the census reported an MBM rate of 8.1% and the CIS reported an MBM rate of 5.5%.
In 2015, the overall MBM rates for Canada were identical from the census (14.5%) and the CIS (14.5%). Despite the difference in the MBM rates between the CIS and the census in 2020, both sources showed a substantial decrease from 2015 in every province.
The differences in the MBM rate between the CIS and the census are related to differences in target populations, reference periods, sampling and collection methods, and approaches to data processing. For example, as shown in the Comparability with other data sources section, the census estimated relatively more economic family units at both ends of the distribution. Specifically, the higher number of family units at the lower end of the distribution—who are typically people that are more difficult to reach in a survey—contributes to high estimates of poverty.
Market basket measure components
The two main components processed in the census are child care expenses and child or spousal support. For child care expenses and child or spousal support payments, the census value comes from the long-form questionnaire, whereas the CIS value is determined through a combination of administrative and survey data. This difference is another source of variation, in addition to those discussed previously in the Comparability with other data sources section.
| Geography | Child care expenses | Child or spousal support payments | ||||||
|---|---|---|---|---|---|---|---|---|
| 2015 | 2020 | 2015 | 2020 | |||||
| Census | CIS | Census | CIS | Census | CIS | Census | CIS | |
| median | median | |||||||
| Canada | 4,091 | Note ...: not applicable | 3,000 | Note ...: not applicable | 5,411 | Note ...: not applicable | 6,000 | Note ...: not applicable |
| Canada (provinces only) | 4,089 | 4,106 | 3,000 | 2,795 | 5,411 | 5,411 | 6,000 | 6,000 |
| Newfoundland and Labrador | 5,205 | 5,411 | 4,000 | 4,000 | 5,194 | 5,411 | 6,000 | 8,400 |
| Prince Edward Island | 4,190 | 5,627 | 3,240 | 3,623 | 4,329 | 3,896 | 5,000 | 5,400 |
| Nova Scotia | 4,329 | 5,194 | 3,275 | 3,600 | 5,194 | 5,194 | 6,000 | 5,400 |
| New Brunswick | 4,329 | 5,194 | 4,116 | 4,360 | 4,502 | 3,896 | 5,000 | 5,400 |
| Quebec | 2,857 | 2,489 | 2,000 | 1,873 | 4,329 | 5,194 | 4,500 | 3,900 |
| Ontario | 5,411 | 5,411 | 3,700 | 3,623 | 6,493 | 6,493 | 7,020 | 7,000 |
| Manitoba | 3,788 | 3,030 | 3,148 | 2,500 | 5,194 | 4,718 | 6,000 | 6,000 |
| Saskatchewan | 4,329 | 4,329 | 4,020 | 5,196 | 6,060 | 6,493 | 6,144 | 7,200 |
| Alberta | 5,194 | 5,411 | 4,210 | 4,000 | 6,818 | 9,090 | 7,200 | 8,568 |
| British Columbia | 4,599 | 5,411 | 4,164 | 4,000 | 6,363 | 4,220 | 7,416 | 7,200 |
| Yukon | 4,329 | Note ...: not applicable | 3,600 | Note ...: not applicable | 5,411 | Note ...: not applicable | 6,000 | Note ...: not applicable |
| Northwest Territories | 5,411 | Note ...: not applicable | 4,800 | Note ...: not applicable | 6,493 | Note ...: not applicable | 7,200 | Note ...: not applicable |
| Nunavut | 4,545 | Note ...: not applicable | 4,000 | Note ...: not applicable | 6,493 | Note ...: not applicable | 6,780 | Note ...: not applicable |
|
... not applicable CIS = Canadian Income Survey
Sources: Statistics Canada, Census of Population, 2016 and 2021; and Canadian Income Survey, 2015 and 2020. |
||||||||
Comparing the census with the CIS data in 2020 and 2015, we see similar trends among child care expenses. Both sources show large decreases in the aggregate sum, 41.0% in the CIS and 33.8% in the census. The trend of decreasing child care expenses is seen throughout every province; however, the decrease in the CIS was larger, except for Saskatchewan, where it decreased by 11.2% in the CIS versus a decrease of 23.1% in the census.
The median for child care expenses, in Table 13, shows a similar coherence between the census and the CIS as seen with the aggregate sum.
The median and counts of child or spousal support payments show similar historical trends in the two surveys. We see a decrease in both the CIS and the census for the count of families who have paid spousal support and an increase in the median amount paid. There are some differences in the trends shown between 2015 and 2020 for aggregate sums. There was an increase in the census (6.7%), whereas the CIS saw a decrease (10.8%) in child or spousal support payments. The largest discrepancies were from Quebec and New Brunswick, which saw increases in the census of 5.2% and 8.9%, respectively, but decreases in the CIS of 31.6% and 17.3%. This is potentially caused by the increased coverage of the census questionnaire in this area. Both the census and the CIS saw fewer people paying, with an increase in median amounts for support payments, and this trend was consistent across the provinces.
Despite some differences in the counts and aggregate amounts, the median amounts of child or spousal support payments for Canada were exactly the same. Table 13 shows some differences at the provincial level.
Non-response and imputation rate for market basket measure components
The non-response and imputation rates for the questions on child care and spousal support are in Table 14. We see a consistent difference of a slightly higher imputation rate compared with the non-response rate. Some responses were considered invalid or inconsistent during the edit stage and imputation was needed, and this is why the imputation rate tends to be higher than the non-response rate.
| Geography | Child care expenses | Child or spousal support payments | ||
|---|---|---|---|---|
| Non-response rate | Imputation rate | Non-response rate | Imputation rate | |
| percent | ||||
| Canada | 3.5 | 3.9 | 3.5 | 3.5 |
| Newfoundland and Labrador | 3.3 | 3.8 | 3.0 | 3.0 |
| Prince Edward Island | 2.9 | 3.2 | 2.7 | 2.7 |
| Nova Scotia | 2.9 | 3.4 | 2.9 | 3.0 |
| New Brunswick | 3.2 | 3.6 | 3.5 | 3.6 |
| Quebec | 2.9 | 3.4 | 3.2 | 3.2 |
| Ontario | 3.3 | 3.8 | 3.1 | 3.2 |
| Manitoba | 3.8 | 4.3 | 4.3 | 4.4 |
| Saskatchewan | 3.8 | 4.2 | 4.4 | 4.5 |
| Alberta | 4.4 | 4.9 | 4.3 | 4.3 |
| British Columbia | 3.8 | 4.2 | 3.6 | 3.7 |
| Yukon | 5.9 | 6.5 | 7.1 | 7.1 |
| Northwest Territories | 10.9 | 11.1 | 13.2 | 13.0 |
| Nunavut | 27.5 | 27.9 | 31.2 | 30.8 |
| Source: Statistics Canada, Census of Population, 2021. | ||||
Data quality of income estimates for subpopulations
The effect of edit and imputation on 2020 estimates for subpopulations
The subpopulations discussed are formed from the long-form sample (25% of the population).
Income estimates could be less reliable and some incoherence might be present when considering subpopulations with lower income linkage rates. Based on the 2021 long-form sample, 95.0% of the population 15 years of age and older in private households was linked to an administrative record from the CRA, 84.8% of the population was linked to a tax filer (T1) record, and 10.2% was linked to non-tax filer records. As a result of edit and imputation, the aggregate total income for the population increased 5.5%.
| Characteristic | Population aged 15 years and older | Tax record linkage rate | Change in aggregate amount during edit and imputation | |||
|---|---|---|---|---|---|---|
| T1 recordTable 15 Note 1 | CRA recordTable 15 Note 2 | Total income | Employment income | Government transfers | ||
| percent | ||||||
| Indigenous identity | ||||||
| Population in private households | 30,335,920 | 84.8 | 95.0 | 5.5 | 5.6 | 4.1 |
| Indigenous identity | 1,348,040 | 71.9 | 88.5 | 14.0 | 14.1 | 12.4 |
| First Nations (North American Indian) | 764,755 | 66.9 | 85.1 | 19.8 | 20.7 | 16.1 |
| Métis | 486,620 | 80.4 | 94.9 | 6.5 | 6.4 | 4.8 |
| Inuk (Inuit) | 47,870 | 61.4 | 75.5 | 31.4 | 30.4 | 32.8 |
| Multiple Indigenous responses | 20,215 | 73.9 | 92.6 | 10.1 | 11.0 | 6.9 |
| Indigenous responses not included elsewhere | 28,580 | 78.1 | 89.6 | 11.0 | 10.1 | 10.6 |
| Non-Indigenous identity | 28,987,880 | 85.4 | 95.3 | 5.2 | 5.3 | 3.7 |
| Visible minorityTable 15 Note 3 | ||||||
| Population in private households | 30,335,920 | 84.8 | 95.0 | 5.5 | 5.6 | 4.1 |
| Total visible minority population | 7,721,915 | 81.7 | 94.2 | 7.3 | 7.4 | 5.0 |
| South Asian | 2,083,390 | 79.9 | 92.3 | 8.1 | 8.2 | 6.7 |
| Chinese | 1,455,195 | 84.4 | 94.6 | 7.7 | 7.9 | 4.8 |
| Black | 1,144,105 | 77.3 | 94.3 | 7.1 | 7.1 | 4.9 |
| Filipino | 781,555 | 86.9 | 96.5 | 4.7 | 4.6 | 3.3 |
| Arab | 512,025 | 83.4 | 95.7 | 6.0 | 6.4 | 3.3 |
| Latin American | 495,585 | 80.2 | 94.3 | 8.4 | 8.6 | 5.5 |
| Southeast Asian | 324,255 | 81.6 | 92.9 | 9.8 | 10.4 | 6.1 |
| West Asian | 298,990 | 84.0 | 96.0 | 6.5 | 7.1 | 3.1 |
| Korean | 183,195 | 81.3 | 94.0 | 7.7 | 8.2 | 5.3 |
| Japanese | 80,550 | 83.1 | 96.0 | 5.5 | 5.8 | 3.0 |
| Visible minority, n.i.e. | 142,120 | 81.8 | 94.7 | 6.8 | 6.6 | 4.3 |
| Multiple visible minorities | 220,955 | 80.0 | 95.3 | 6.5 | 6.5 | 4.2 |
| Not a visible minorityTable 15 Note 4 | 22,614,005 | 85.9 | 95.2 | 5.0 | 5.0 | 3.9 |
| Immigration status and period of immigration | ||||||
| Population in private households | 30,335,920 | 84.8 | 95.0 | 5.5 | 5.6 | 4.1 |
| Non-immigrants | 21,518,695 | 84.7 | 95.1 | 5.1 | 5.1 | 4.1 |
| Immigrants | 7,980,095 | 88.3 | 95.5 | 5.6 | 5.8 | 3.3 |
| Before 2020 | 7,781,310 | 88.8 | 95.5 | 5.5 | 5.7 | 3.3 |
| In 2020 | 128,975 | 81.6 | 95.3 | 7.9 | 7.6 | 6.4 |
| In 2021 | 69,810 | 43.9 | 92.6 | 14.6 | 13.9 | 10.2 |
| Non-permanent residents | 837,130 | 53.5 | 86.1 | 24.4 | 23.2 | 25.4 |
n.i.e = not included elsewhere
|
||||||
Table 15 shows the linkage rates and the changes from edit and imputation for various subpopulations. T1 linkage rates for some populations can be lower partially because of differences in their age distributions and proportions with lower incomes. The T1 filing rates for younger people and people with lower income are typically lower because they are less often required to file taxes given their circumstances.
The T1 linkage rates for non-permanent residents and very recent immigrants (those who landed in Canada as immigrants in 2020 and 2021) were noticeably lower. This trend was also seen in the 2016 Census. Generally, these populations had lower income than other Canadian residents living in private households. However, because of the lack of additional context and information on their length of stay in Canada in 2020, it would be difficult to contrast their income situation with that of other residents.
Owing to the unique situations among the 2020 and 2021 immigrants and non-permanent residents, their income estimates may be less reliable and may not be directly comparable with other population groups. Users should use caution when interpreting data for these groups.
Inconsistency between presence of employment income and work activity
As was the case in the data from the 2016 Census, there are some inconsistencies between the presence of employment income and work activity reported in the 2021 Census data (see Table 16).
| Presence of employment income | 2016 Census | 2021 Census | ||||
|---|---|---|---|---|---|---|
| Did not work | Worked full year, full time | All others | Did not work | Worked full year, full time | All others | |
| Total―Population aged 15 years and older | 9,282,005 | 9,626,010 | 9,735,000 | 11,140,775 | 10,215,385 | 8,979,755 |
| Without employment income | 7,352,735 | 258,960 | 602,645 | 8,352,545 | 302,575 | 553,110 |
| With employment income | 1,929,270 | 9,367,045 | 9,132,355 | 2,788,235 | 9,912,810 | 8,426,645 |
| With employment income less than $1,000Table 16 Note 1 | 759,510 | 83,985 | 366,295 | 841,320 | 89,155 | 358,070 |
| With employment income between $1,000 and $4,999 | 363,040 | 101,790 | 979,870 | 514,255 | 107,455 | 1,040,785 |
| With employment income of $5,000 and over | 806,720 | 9,181,275 | 7,786,190 | 1,432,655 | 9,716,195 | 7,027,790 |
| Total―Population aged 15 years and older (%) | 100.0 | 100.0 | 100.0 | 100.0 | 100.0 | 100.0 |
| Without employment income (%) | 79.2 | 2.7 | 6.2 | 75.0 | 3.0 | 6.2 |
| With employment income (%) | 20.8 | 97.3 | 93.8 | 25.0 | 97.0 | 93.8 |
| With employment income less than $1,000Table 16 Note 1 (%) | 8.2 | 0.9 | 3.8 | 7.6 | 0.9 | 4.0 |
| With employment income between $1,000 and $4,999 (%) | 3.9 | 1.1 | 10.1 | 4.6 | 1.1 | 11.6 |
| With employment income of $5,000 and over (%) | 8.7 | 95.4 | 80.0 | 12.9 | 95.1 | 78.3 |
Sources: Statistics Canada, Census of Population, 2016 and 2021. |
||||||
The magnitude of these inconsistencies in the 2021 Census is similar to what was observed in the 2016 Census. One exception is that among people who did not report any work activity, a higher proportion had some earnings for the reference year in the 2021 Census compared with the 2016 Census. The proportion was 4.2 percentage points higher (25.0% for 2021 versus 20.8% for 2016), and this could be due to the COVID-19 pandemic and the timing of shutdowns beginning in March 2020. In January and February 2020, individuals may have had employment income, which would be reflected in the tax system. This early 2020 employment income may have been forgotten by the time the census questionnaire was received in May 2021, leading to a larger incoherence.
Please see the 2016 Income Reference Guide for more information on factors that give rise to the inconsistencies between employment income and work activity.
- Date modified: