
Housing Characteristics Reference Guide, Census of Population, 2021
Release date: March 30, 2022 (preliminary) Updated on: November 30, 2022
Skip to text
Text begins
Definitions and concepts
The 2021 Census of Population questions collected information on housing for all private households. Housing-related variables can be classified into three groups: (1) dwelling characteristics, (2) household characteristics related to shelter costs and (3) other household characteristics.
Dwelling characteristics refer to the physical attributes of the living quarters occupied by the household. The Census of Population collected the following information: number of rooms, number of bedrooms, period of construction, dwelling condition, condominium status and value (owner estimated) of dwelling. Information on dwelling characteristics, except the value of the dwelling, was collected for all occupied private dwellings. Information on the value of the dwelling was collected only for owner-occupied dwellings that were not located on an agricultural operation operated by a member of the household. This exception was made because households that rent their dwelling have difficulty assessing its value since they were not involved in the purchase. Furthermore, owner-occupied dwellings that were part of an agricultural operation were excluded because often the value of the dwelling cannot be separated from the value of the agricultural operation.
Shelter costs refer to the total average dwelling-related expenses paid by households. The Census of Population collected the following information related to shelter costs: whether a rented dwelling was subsidized (see subsidized housing) and whether an owned dwelling had a mortgage (see presence of mortgage payments). Information on shelter costs and the related variables was disseminated for owner-occupied and renter-occupied dwellings and dwellings provided by the local government, First Nation or Indian band. Information on shelter costs was not collected or disseminated for dwellings that were part of an agricultural operation operated by a member of the household because often the shelter costs of the dwelling cannot be separated from the shelter costs of the agricultural operation.
Household characteristics refer to characteristics of the person or group of persons occupying the private dwelling. These differ from the characteristics of individual persons, in that household characteristics are generally intended to describe all household members. Information on household characteristics collected by the Census of Population that is commonly used in housing analysis includes tenure, household size, household total income and household type. Information on household characteristics was collected for all private households. The Census of Population also collected information to identify household maintainers, i.e., which household members paid the shelter costs. A common approach in housing analysis is to examine the characteristics of the primary household maintainer (e.g., age) in relation to the dwelling, shelter costs and other household characteristics.
Housing adequacy, housing suitability, housing affordability, acceptable housing and core housing need are key household indicators and topics of interest for governments and housing organizations. Variables from the Census of Population are combined to create household indicators that help governments and organizations manage the state of housing in Canada.
An indicator of housing adequacy is the condition of the dwelling. An indicator of housing suitability (commonly used to measure “crowding”) is whether the dwelling has enough bedrooms for the size and composition of the household. Another indicator of crowding is the number of persons per room in a dwelling. An indicator of housing affordability is the proportion of household total income that is spent on shelter costs. Acceptable housing refers to housing that is adequate in condition, suitable in size and affordable. Core housing need is an indicator of a household’s relative ability to afford the median market rent of a dwelling in its region that meets its needs.
For additional information, please see the Dictionary, Census of Population, 2021, Statistics Canada Catalogue no. 98-301-X.
Questions
For the 2021 Census, the 2A short-form questionnaire was used to enumerate all usual residents of 75% of private dwellings. The 2A-L long-form questionnaire, which also includes the questions from the 2A short-form questionnaire, was used to enumerate a 25% sample of private households in Canada. For private households in First Nations communities, Métis settlements, Inuit regions and other remote areas, the 2A-R questionnaire was used to enumerate 100% of the population. On both the 2A-L and the 2A-R questionnaires, data on housing were collected in Step E. The first page of housing questions (E1 to E6) collected information on household and dwelling characteristics applicable to all private households, regardless of housing tenure. The second page of housing questions (E7 to E9 on the 2A-L questionnaire, E7 to E10 on the 2A-R questionnaire) collected shelter cost information. Skip patterns on the shelter cost questions were based on housing tenure, as the components of shelter costs vary based on this characteristic.
The main difference between the housing questions on the 2A-L and 2A-R questionnaires was that the 2A-R questionnaire asked whether the dwelling was provided by the local government, First Nation or Indian band to establish skip patterns for the shelter cost questions. In addition, the examples presented in the question on the number of rooms and bedrooms were different on the 2A-R questionnaire so that the examples would be relevant for northern areas. The 2021 2A-R questionnaire also included a new question on user or occupancy fees for housing provided by local governments, First Nations or Indian bands. Otherwise, the housing questions were identical.
For more information on the reasons why the census questions are asked, please refer to the five fact sheets found on The road to the 2021 Census web page.
Note: Information on the historical comparability of the 2021 Census questions and those asked in earlier censuses is provided in the Comparability section of this document.
Classifications
Classifications used for indicators of housing adequacy, housing suitability, housing affordability and core housing need are based on generally accepted classifications used by governments and housing organizations such as the Canada Mortgage and Housing Corporation (CMHC).
Dwelling condition (an indicator of housing adequacy) is classified into three groups: needing regular maintenance only, needing minor repairs and needing major repairs. A need for major repairs is considered an indicator of inadequate dwellings by housing organizations. At the time of the census, to guide respondents in answering the question on the condition of the dwelling, examples were included in each response category. The examples of major repairs were intended to capture problems that compromised the dwelling’s structure or major systems (i.e., heating, plumbing and electrical). Specifically, the questionnaire contained the following examples for major repairs: defective plumbing or electrical wiring, and structural repairs to walls, floors or ceilings. Examples of regular maintenance and minor repairs were also included on the questionnaire. For minor repairs, the examples on the questionnaire were missing or loose floor tiles, bricks or shingles, and defective steps, railing or siding. For regular maintenance, the examples on the questionnaire were painting and furnace cleaning.
The housing suitability of a dwelling is based on the National Occupancy Standard (NOS) developed by CMHC. The housing suitability indicator classifies dwellings as not suitable if they do not have enough bedrooms for the size and composition of the household, as calculated using the NOS. Dwellings that are not suitable are also further classified by the shortfall in the number of bedrooms when compared with the required number of bedrooms based on the NOS. The 2021 Census estimates of housing suitability are based on a derivation of the indicator which uses gender.
Persons per room is a measure of crowding that considers all rooms in a private dwelling and the number of members of the household. A higher number of persons per room indicates a higher level of crowding. Generally, housing research in Canada uses a threshold of more than one person per room to determine that a dwelling in Canada is crowded. The United Nations considers densities of three or more persons per room to be overcrowded under any circumstance, but states that this level may be raised or lowered for national use.
The shelter-cost-to-income ratio (an indicator of housing affordability) is classified into several ranges, as shown in the data tables. The classification related to housing affordability is whether the occupants of the dwelling paid 30% or more of household total income toward shelter costs. In 1986, CMHC and the provinces agreed to use the 30% threshold to measure affordability for the purposes of defining social housing need. This agreement was reached during the development of federal and provincial social housing programs. Research on housing affordability in the territories often uses the same threshold.
Core housing need is a two-stage indicator that helps to identify who needs housing assistance. It has been used in Canada since the 1980s and was developed by CMHC in collaboration with the provinces and territories. Assessing a household for core housing need involves determining whether the household falls below at least one of the adequacy, affordability or suitability standards and whether before-tax income is sufficient to access acceptable local housing (i.e., that meets all three housing standards).
Classifications for housing variables are listed in the Dictionary, Census of Population, 2021, Statistics Canada Catalogue no. 98-301-X.
Concepts over time
For the 2021 Census, the shelter cost of private households includes user or occupancy fees for housing provided by local governments, First Nations or Indian bands. In previous cycles, these households were asked to report only payments for electricity, heat, water and other services. For historical and statutory reasons, the components of shelter costs related to owner households (mortgage payments, property taxes and condominium fees) and renter households (rent payments) do not always apply to dwellings provided by the local government, First Nation or Indian band. In consultations for the 2021 Census of Population, the consensus among stakeholders and data users was that there is a clear need to collect and disseminate information based on a complete shelter cost concept for all housing across Canada, including households living on reserve.
Collection and processing methods
The COVID-19 pandemic emerged in Canada in early 2020 and affected all steps of the 2021 Census process, from data collection to dissemination. Please refer to the Guide to the Census of Population, 2021, Statistics Canada Catalogue no. 98-304-X for more detailed information on this topic.
Data quality
The 2021 Census of Population underwent a thorough data quality assessment. The different certification activities conducted to evaluate the quality of the 2021 Census data are described in Chapter 9 of the Guide to the Census of Population, 2021, Statistics Canada Catalogue no. 98-304-X.
The data quality assessment was conducted in addition to the regular verifications and quality checks completed at key stages of the census. For example, throughout data collection and processing, the accuracy of specific steps such as data capture and coding was measured, the consistency of the responses provided was checked, and the non-response rates for each question were analyzed. As well, the quality of imputed responses was assessed during data editing and imputation.
During the data quality assessment, a number of data quality indicators were produced and used to evaluate the quality of the data. These indicators are briefly described below. Finally, resulting census counts were compared with other data sources and certified for final release.
The main highlights of this assessment of the data pertaining to housing characteristics content are presented below.
Variability due to sampling and total non-response
The objective of the long-form census questionnaire is to produce estimates on various topics for a wide variety of geographies, ranging from very large areas (such as provinces and census metropolitan areas) to very small areas (such as neighbourhoods and municipalities), and for various populations (such as Indigenous peoples and immigrants) that are generally referred to in this document as “populations of interest.” In order to reduce response burden, the long-form census questionnaire is administered to a random sample of households.
This sampling approach and total non-response introduce variability into the estimates that needs to be accounted for. This variability also depends on the population size and the variability of the characteristics being measured. Furthermore, the precision of estimates may vary considerably depending on the domain or geography of interest, in particular because of the variation in response rates. For more information on variability due to sampling and total non-response in long-form census questionnaire estimates, please refer to the Guide to the Census of Population, 2021, Statistics Canada Catalogue no. 98-304-X.
Non-response bias
Non-response bias is a potential source of error for all surveys, including the long-form census questionnaire. Non-response bias arises when the characteristics of those who participate in a survey are different from those who do not.
In general, the risk of non-response bias increases as the response rate declines. For the 2021 long-form census questionnaire, Statistics Canada adapted its collection and estimation procedures to mitigate the effect of non-response bias to the extent possible. For more information on these mitigation strategies, please refer to the Guide to the Census of Population, 2021, Statistics Canada Catalogue no. 98-304-X.
Data quality indicators
A number of quality indicators were produced and analyzed during the 2021 Census of Population data quality assessment. Four indicators are available to data users for long-form content: the total non-response (TNR) rate; the confidence interval; as well as the non-response rate and the imputation rate per question.
The total non-response (TNR) rate is the primary quality indicator that accompanies each disseminated 2021 Census of Population product, and is calculated for each geographic area. It measures total non-response at the dwelling level. Non-response is said to be total when no questionnaire is returned from a dwelling or when a returned questionnaire does not meet the minimum content. More information on the TNR rate is available in Chapter 9 of the Guide to the Census of Population, 2021, Statistics Canada Catalogue no. 98-304-X.
The confidence interval was selected as a variance-based quality indicator to accompany the 2021 Census of Population long-form estimates because it helps users easily make a statistical inference. This indicator provides a measure of the accuracy of the long-form estimates. Using a science-based approach, research and simulations were done to ensure that confidence intervals are constructed using adequate statistical methods for the Census of Population data and areas of interest.
A confidence interval is associated with a confidence level, generally set at 95%. A 95% confidence interval is an interval constructed around the estimate so that, if the process that generated the sample were repeated many times, the value of the interest parameter in the population would be contained in 95% of these intervals. The confidence interval consists of a lower bound and an upper bound. These two bounds accompany the long-form estimates in most data tables.
Further details on the different methods used to construct confidence intervals and their assumptions are provided in the Sampling and Weighting Technical Report, Census of Population, 2021, Statistics Canada Catalogue no. 98-306-X.
The non-response rate per question is a measure of missing information due to non-response to a question. It measures only the non-response that is resolved through imputation during data processing (as opposed to weighting when a sample is used). For the long-form questionnaire, the non-response rate per question includes only partial non-response to the question, except for First Nations communities, Métis settlements, Inuit regions and other remote areas where both partial and total non-response are taken into account. Partial non-response is when answers to certain questions are not provided for a respondent household.
The non-response rate per question for a question on the long-form questionnaire is defined as the sum of the weights of in-scope units in the population of interest who did not respond to the question divided by the sum of the weights of in-scope units in the population of interest. Here “units” refers to the statistical units for which data are collected or derived (e.g., persons or households, depending on whether the question is about a person-level characteristic or a household-level characteristic). A unit is considered to be in scope for a given question if the question is applicable to that unit and the unit belongs to the population of interest related to the question.
The imputation rate per question measures the extent to which responses to a given question were imputed. Imputation is used to replace missing data in the event of non-response or when a response is found to be invalid (e.g., multiple answers are provided when a single answer is expected). Imputation is conducted to eliminate data gaps and to reduce bias introduced by non-response. Imputation is generally done by identifying persons or households in the same geographical area with similar characteristics to the incomplete record and copying their values to fill in the missing or invalid responses.
The imputation rate for a question on the long-form questionnaire is defined as the sum of the weights of in-scope units in the population of interest for which the response to the question was imputed divided by the sum of the weights of in-scope units in the population of interest (see the definition of “units” provided in the above section on the non-response rate per question).
For long-form content, imputation for most areas is done to resolve partial non-response—not total non-response, which instead is treated by weighting. However, in First Nations communities, Métis settlements, Inuit regions and other remote areas, whole household imputation (WHI) is used to resolve total non-response. It first imputes the occupancy status of non-respondent dwellings and further imputes all the data for those dwellings resolved as occupied in the first step. WHI is included in the imputation rate per question, including the use of administrative data to impute non-responding households in areas with low response rates; see Appendix 1.7 of the Guide to the Census of Population, 2021, Statistics Canada Catalogue no. 98-304-X. As with the non-response rate, a unit is considered to be in scope if the question is applicable to that unit and the unit belongs to the population of interest related to the question.
The non-response and imputation rates per question can be interpreted as the proportion of in-scope units in the population of interest for which information was not reported or was imputed, respectively. The long-form rates are weighted to reflect the fact that the long-form questionnaire is only distributed to a sample of the population, so in this case, the proportion is estimated.
The non-response and imputation rates for a question are often similar, but some differences can be observed for a given question because of additional data processing steps that may have been required. These rates were regularly checked during data assessment, and a detailed analysis was done if there was a difference between the two rates for a question, to ensure the appropriateness of the processing steps taken and the quality of the data. A difference between the non-response rate and the imputation rate for a question can generally be explained by one of the following two factors:
- Some responses were considered invalid or inconsistent during the edit stage and imputation was needed, which is why the imputation rate is higher than the non-response rate for a question.
- Some non-responses were resolved in a straightforward manner early during data processing because a single resolution was possible based on the answers provided to other questions, making imputation unnecessary. This may explain why the non-response rate is higher than the imputation rate for a question.
The non-response and imputation rates per question at lower levels of geography are also available in 2021 Census data tables presenting data quality indicators. This information is scheduled for release on August 17, 2022, for short-form questions and on November 30, 2022, for long-form questions.
The 2021 Census Data Quality Guidelines, Statistics Canada Catalogue no. 98-26-0006 provides all the information required to understand and interpret the data quality indicators for the 2021 Census, along with guidelines to enable their proper usage. Data quality indicators are provided so that users are informed about the quality of the statistical information provided and can determine the relevance and the limitations of the data relative to their needs. In general, the quality of the 2021 Census of Population data is very good, but in some cases data have to be used with caution. It is strongly recommended that users consult all available data quality indicators to get a better sense of the quality of the data products in which they are interested.
Certification of final counts
Once data editing and imputation were completed, the data were weighted to ensure that estimates represent the total Canadian population living in private dwellings. Certification of the final weighted estimates was the last step in the validation process, which led to the recommendation to release the data for each level of geography and domain of interest. Based on the analysis of the data quality indicators and the comparison of long-form census questionnaire estimates with other data sources, the recommendation is for unconditional release, conditional release, or non-release (for quality reasons on rare occasions). For conditional release or non-release, appropriate notes and warnings are included in the products and provided to users. Moreover, other data sources were used to evaluate the long-form census questionnaire estimates. However, since the risk of error often increases for lower levels of geography and for smaller populations, and the data sources used to evaluate these counts are less reliable or not available at these lower levels, it can be difficult to certify the counts at these levels.
Long-form census questionnaire estimates are also subject to confidentiality rules that ensure non-disclosure of respondent identity and characteristics. For more information on privacy and confidentiality, please refer to Chapter 1 of the Guide to the Census of Population, 2021, Statistics Canada Catalogue no. 98-304-X. For information on how Statistics Canada balances the protection of confidentiality and the need for disaggregated census data, with specific attention to new 2021 Census content, please refer to Balancing the Protection of Confidentiality with the Needs for Disaggregated Census Data, Census of Population, 2021, Statistics Canada Catalogue no. 98-26-0005.
For more information on data processing and the calculation of estimates and their level of precision, please refer to the Sampling and Weighting Technical Report, Census of Population, 2021, Statistics Canada Catalogue no. 98-306-X.
Data quality for housing characteristics
The housing variables from the 2021 Census of Population are recommended for unconditional release based on the overall quality of the data. Considerable effort is made throughout the entire process to ensure high standards of data quality; however, the resulting data, particularly for smaller regions and populations, are accompanied by a degree of variability. The evaluation of the housing variables consisted of the following:
- examination of the non-response and imputation rates for the housing variables
- historical comparison with data from previous censuses
- comparison with other sources of data as applicable.
To assess the appropriateness of the 2021 Census of Population data for users’ purposes, and to understand the risk involved in drawing conclusions or making decisions based on these data, users should be aware of the following data quality indicators for the housing variables.
Tables 1a, b and c and 2a, b and c below present the non-response and imputation rates per question for Canada and for each province and territory.
Question-level non-response rates
Non-response rates per question were quite low overall across the housing questions at the national, provincial and territorial levels. However, there were substantial differences in the non-response rates per question between the 2A-L and 2A-R questionnaires. The 2A-L collection methodology changed very little from the methods used in 2016. At the same time, adjustments to the 2A-R collection methods were required to reduce in-person contact in response to public health guidelines related to the COVID-19 pandemic. These changes and the conditions experienced while collecting the data resulted in higher non-response rates per question, particularly for the housing questions, which are located at the end of the questionnaire.
| Question no. | Variable | Canada | N.L. | P.E.I. | N.S. | N.B. | Que. | Ont. | Man. | Sask. | Alta. | B.C. | Y.T. | N.W.T. | Nvt. |
|---|---|---|---|---|---|---|---|---|---|---|---|---|---|---|---|
| percent | |||||||||||||||
| 58 | Household maintainerTable 1a Non-response rates per question, Canada, provinces and territories, Census of Population, 2021 Note 1 |
3.3 | 2.9 | 2.5 | 2.8 | 3.4 | 3.1 | 3.0 | 4.2 | 4.3 | 4.1 | 3.5 | 7.1 | 12.6 | 29.6 |
| E1 | TenureTable 1a Non-response rates per question, Canada, provinces and territories, Census of Population, 2021 Note 2 |
3.0 | 2.4 | 2.2 | 2.5 | 3.1 | 2.7 | 2.7 | 4.0 | 4.2 | 3.8 | 3.1 | 7.3 | 12.5 | 36.0 |
| E2 | Condominium statusTable 1a Non-response rates per question, Canada, provinces and territories, Census of Population, 2021 Note 2 |
3.0 | 2.3 | 2.3 | 2.5 | 3.0 | 2.7 | 2.6 | 3.9 | 4.4 | 3.8 | 3.1 | 7.6 | 13.6 | 37.8 |
| E3(a) | RoomsTable 1a Non-response rates per question, Canada, provinces and territories, Census of Population, 2021 Note 2 |
2.9 | 2.2 | 2.1 | 2.3 | 2.9 | 2.5 | 2.6 | 3.8 | 4.1 | 3.8 | 3.0 | 7.6 | 12.3 | 36.5 |
| E3(b) | BedroomsTable 1a Non-response rates per question, Canada, provinces and territories, Census of Population, 2021 Note 2 |
2.9 | 2.2 | 2.1 | 2.3 | 2.9 | 2.5 | 2.6 | 3.8 | 4.1 | 3.7 | 3.0 | 7.6 | 12.4 | 36.2 |
| E4 | Period of constructionTable 1a Non-response rates per question, Canada, provinces and territories, Census of Population, 2021 Note 2 |
3.7 | 2.8 | 3.1 | 3.3 | 3.9 | 3.6 | 3.4 | 4.8 | 5.0 | 4.5 | 3.6 | 8.8 | 14.1 | 39.5 |
| E5 | Condition of dwellingTable 1a Non-response rates per question, Canada, provinces and territories, Census of Population, 2021 Note 2 |
2.9 | 2.3 | 2.2 | 2.4 | 3.0 | 2.7 | 2.6 | 3.8 | 4.1 | 3.7 | 3.0 | 7.4 | 12.4 | 36.2 |
| E7(a) | Electricity paymentTable 1a Non-response rates per question, Canada, provinces and territories, Census of Population, 2021 Note 3 |
5.4 | 4.3 | 5.0 | 4.7 | 5.6 | 4.5 | 5.1 | 7.0 | 8.1 | 7.1 | 5.5 | 11.2 | 14.6 | 38.9 |
| E7(b) | Fuel paymentTable 1a Non-response rates per question, Canada, provinces and territories, Census of Population, 2021 Note 3 |
5.8 | 5.1 | 5.3 | 4.9 | 6.2 | 5.2 | 5.3 | 7.6 | 8.4 | 7.4 | 5.8 | 11.4 | 14.7 | 39.4 |
| E7(c) | Water and other service paymentTable 1a Non-response rates per question, Canada, provinces and territories, Census of Population, 2021 Note 3 |
5.8 | 4.9 | 5.4 | 4.9 | 6.1 | 5.3 | 5.3 | 7.2 | 8.4 | 7.4 | 5.8 | 11.4 | 14.7 | 39.4 |
| E8(a) | RentTable 1a Non-response rates per question, Canada, provinces and territories, Census of Population, 2021 Note 4 |
5.3 | 4.6 | 4.7 | 4.7 | 5.8 | 4.5 | 5.3 | 6.0 | 6.8 | 6.4 | 5.2 | 12.4 | 28.6 | 58.4 |
| E8(b) | Subsidy statusTable 1a Non-response rates per question, Canada, provinces and territories, Census of Population, 2021 Note 4 |
5.5 | 4.5 | 5.0 | 4.9 | 6.2 | 4.7 | 5.4 | 6.2 | 7.1 | 6.6 | 5.3 | 11.7 | 28.9 | 59.2 |
| E9(a) | Mortgage paymentTable 1a Non-response rates per question, Canada, provinces and territories, Census of Population, 2021 Note 5 |
4.9 | 4.0 | 4.9 | 4.2 | 4.9 | 4.1 | 4.6 | 5.8 | 6.9 | 6.5 | 5.2 | 9.5 | 13.8 | 38.6 |
| E9(b) | Property taxes included in mortgageTable 1a Non-response rates per question, Canada, provinces and territories, Census of Population, 2021 Note 5 Table 1a Non-response rates per question, Canada, provinces and territories, Census of Population, 2021 Note 6 |
5.0 | 3.8 | 4.7 | 4.0 | 4.8 | 4.1 | 4.7 | 5.6 | 6.5 | 6.5 | 5.3 | 8.0 | 12.9 | 40.0 |
| E9(c) | Property taxesTable 1a Non-response rates per question, Canada, provinces and territories, Census of Population, 2021 Note 5 Table 1a Non-response rates per question, Canada, provinces and territories, Census of Population, 2021 Note 7 |
5.2 | 4.7 | 5.7 | 4.9 | 5.7 | 4.4 | 4.8 | 6.1 | 7.4 | 6.6 | 5.6 | 11.4 | 15.9 | 42.8 |
| E9(d) | Value of dwellingTable 1a Non-response rates per question, Canada, provinces and territories, Census of Population, 2021 Note 5 |
5.9 | 5.0 | 6.4 | 5.5 | 6.5 | 5.2 | 5.6 | 6.9 | 7.9 | 7.3 | 6.2 | 11.3 | 16.6 | 42.8 |
| E9(e) | Condominium feeTable 1a Non-response rates per question, Canada, provinces and territories, Census of Population, 2021 Note 5 Table 1a Non-response rates per question, Canada, provinces and territories, Census of Population, 2021 Note 8 |
9.1 | 6.7 | 5.9 | 5.5 | 7.3 | 4.7 | 9.5 | 6.9 | 7.4 | 7.7 | 13.7 | 9.3 | 6.5 | 34.7 |
| E10 | Monthly use or occupancy payment for dwellingTable 1a Non-response rates per question, Canada, provinces and territories, Census of Population, 2021 Note 9 |
44.5 | 53.2 | 15.6 | 33.0 | 28.1 | 47.2 | 43.2 | 43.9 | 45.8 | 51.8 | 43.7 | 38.5 | 40.0 | Note ...: not applicable |
... not applicable
|
|||||||||||||||
| Question no. | Variable | Canada | N.L. | P.E.I. | N.S. | N.B. | Que. | Ont. | Man. | Sask. | Alta. | B.C. | Y.T. | N.W.T. | Nvt. |
|---|---|---|---|---|---|---|---|---|---|---|---|---|---|---|---|
| percent | |||||||||||||||
| 58 | Household maintainerTable 1b Non-response rates per question, 2A-L questionnaire, Canada, provinces and territories, Census of Population, 2021 Note 1 |
3.0 | 2.6 | 2.5 | 2.6 | 3.2 | 2.9 | 2.9 | 3.1 | 3.0 | 3.7 | 3.1 | 3.0 | 1.8 | Note ...: not applicable |
| E1 | TenureTable 1b Non-response rates per question, 2A-L questionnaire, Canada, provinces and territories, Census of Population, 2021 Note 2 |
2.7 | 2.1 | 2.2 | 2.3 | 2.9 | 2.6 | 2.6 | 2.9 | 2.9 | 3.4 | 2.7 | 2.8 | 1.8 | Note ...: not applicable |
| E2 | Condominium statusTable 1b Non-response rates per question, 2A-L questionnaire, Canada, provinces and territories, Census of Population, 2021 Note 2 |
2.6 | 2.0 | 2.2 | 2.2 | 2.8 | 2.5 | 2.5 | 2.8 | 2.9 | 3.4 | 2.7 | 3.0 | 1.7 | Note ...: not applicable |
| E3(a) | RoomsTable 1b Non-response rates per question, 2A-L questionnaire, Canada, provinces and territories, Census of Population, 2021 Note 2 |
2.6 | 1.9 | 2.1 | 2.1 | 2.7 | 2.4 | 2.5 | 2.7 | 2.7 | 3.4 | 2.6 | 2.8 | 1.4 | Note ...: not applicable |
| E3(b) | BedroomsTable 1b Non-response rates per question, 2A-L questionnaire, Canada, provinces and territories, Census of Population, 2021 Note 2 |
2.5 | 1.8 | 2.0 | 2.1 | 2.6 | 2.4 | 2.5 | 2.7 | 2.7 | 3.3 | 2.6 | 2.8 | 1.6 | Note ...: not applicable |
| E4 | Period of constructionTable 1b Non-response rates per question, 2A-L questionnaire, Canada, provinces and territories, Census of Population, 2021 Note 2 |
3.4 | 2.5 | 3.0 | 3.1 | 3.7 | 3.4 | 3.3 | 3.6 | 3.6 | 4.2 | 3.2 | 4.0 | 2.3 | Note ...: not applicable |
| E5 | Condition of dwellingTable 1b Non-response rates per question, 2A-L questionnaire, Canada, provinces and territories, Census of Population, 2021 Note 2 |
2.6 | 1.9 | 2.2 | 2.2 | 2.8 | 2.5 | 2.5 | 2.7 | 2.7 | 3.3 | 2.6 | 2.6 | 1.5 | Note ...: not applicable |
| E7(a) | Electricity paymentTable 1b Non-response rates per question, 2A-L questionnaire, Canada, provinces and territories, Census of Population, 2021 Note 3 |
5.1 | 4.0 | 5.0 | 4.5 | 5.4 | 4.3 | 4.9 | 5.8 | 6.7 | 6.7 | 5.1 | 6.2 | 3.6 | Note ...: not applicable |
| E7(b) | Fuel paymentTable 1b Non-response rates per question, 2A-L questionnaire, Canada, provinces and territories, Census of Population, 2021 Note 3 |
5.4 | 4.8 | 5.2 | 4.7 | 6.0 | 5.0 | 5.2 | 6.5 | 7.0 | 7.0 | 5.3 | 6.5 | 3.5 | Note ...: not applicable |
| E7(c) | Water and other service paymentTable 1b Non-response rates per question, 2A-L questionnaire, Canada, provinces and territories, Census of Population, 2021 Note 3 |
5.5 | 4.6 | 5.3 | 4.7 | 5.8 | 5.2 | 5.2 | 6.0 | 6.9 | 6.9 | 5.4 | 6.5 | 3.6 | Note ...: not applicable |
| E8(a) | RentTable 1b Non-response rates per question, 2A-L questionnaire, Canada, provinces and territories, Census of Population, 2021 Note 4 |
5.0 | 4.5 | 4.7 | 4.6 | 5.8 | 4.3 | 5.3 | 5.7 | 6.0 | 6.2 | 5.0 | 6.5 | 5.3 | Note ...: not applicable |
| E8(b) | Subsidy statusTable 1b Non-response rates per question, 2A-L questionnaire, Canada, provinces and territories, Census of Population, 2021 Note 4 |
5.2 | 4.3 | 5.0 | 4.8 | 6.1 | 4.4 | 5.4 | 5.8 | 6.3 | 6.4 | 5.1 | 5.9 | 5.0 | Note ...: not applicable |
| E9(a) | Mortgage paymentTable 1b Non-response rates per question, 2A-L questionnaire, Canada, provinces and territories, Census of Population, 2021 Note 5 |
4.8 | 3.8 | 4.9 | 4.2 | 4.9 | 4.0 | 4.5 | 5.5 | 6.7 | 6.4 | 4.9 | 5.4 | 2.6 | Note ...: not applicable |
| E9(b) | Property taxes included in mortgageTable 1b Non-response rates per question, 2A-L questionnaire, Canada, provinces and territories, Census of Population, 2021 Note 5 Table 1b Non-response rates per question, 2A-L questionnaire, Canada, provinces and territories, Census of Population, 2021 Note 6 |
4.9 | 3.7 | 4.7 | 4.0 | 4.8 | 4.1 | 4.7 | 5.5 | 6.3 | 6.4 | 5.2 | 5.4 | 2.9 | Note ...: not applicable |
| E9(c) | Property taxesTable 1b Non-response rates per question, 2A-L questionnaire, Canada, provinces and territories, Census of Population, 2021 Note 5 Table 1b Non-response rates per question, 2A-L questionnaire, Canada, provinces and territories, Census of Population, 2021 Note 7 |
5.0 | 4.4 | 5.6 | 4.8 | 5.7 | 4.4 | 4.7 | 5.8 | 7.1 | 6.5 | 5.2 | 6.9 | 2.8 | Note ...: not applicable |
| E9(d) | Value of dwellingTable 1b Non-response rates per question, 2A-L questionnaire, Canada, provinces and territories, Census of Population, 2021 Note 5 |
5.8 | 4.8 | 6.4 | 5.4 | 6.5 | 5.2 | 5.5 | 6.5 | 7.6 | 7.1 | 5.7 | 6.7 | 2.6 | Note ...: not applicable |
| E9(e) | Condominium feeTable 1b Non-response rates per question, 2A-L questionnaire, Canada, provinces and territories, Census of Population, 2021 Note 5 Table 1b Non-response rates per question, 2A-L questionnaire, Canada, provinces and territories, Census of Population, 2021 Note 8 |
9.1 | 6.7 | 5.8 | 5.5 | 7.2 | 4.7 | 9.5 | 6.9 | 7.4 | 7.7 | 13.6 | 8.9 | 5.3 | Note ...: not applicable |
| E10 | Monthly use or occupancy payment for dwellingTable 1b Non-response rates per question, 2A-L questionnaire, Canada, provinces and territories, Census of Population, 2021 Note 9 |
Note ...: not applicable | Note ...: not applicable | Note ...: not applicable | Note ...: not applicable | Note ...: not applicable | Note ...: not applicable | Note ...: not applicable | Note ...: not applicable | Note ...: not applicable | Note ...: not applicable | Note ...: not applicable | Note ...: not applicable | Note ...: not applicable | Note ...: not applicable |
... not applicable
|
|||||||||||||||
| Question no. | Variable | Canada | N.L. | P.E.I. | N.S. | N.B. | Que. | Ont. | Man. | Sask. | Alta. | B.C. | Y.T. | N.W.T. | Nvt. |
|---|---|---|---|---|---|---|---|---|---|---|---|---|---|---|---|
| percent | |||||||||||||||
| 58 | Household maintainerTable 1c Non-response rates per question, 2A-R questionnaire, Canada, provinces and territories, Census of Population, 2021 Note 1 |
32.7 | 27.8 | 11.2 | 24.5 | 21.6 | 35.5 | 34.6 | 30.5 | 29.0 | 43.6 | 34.3 | 28.5 | 22.9 | 29.6 |
| E1 | TenureTable 1c Non-response rates per question, 2A-R questionnaire, Canada, provinces and territories, Census of Population, 2021 Note 2 |
36.2 | 27.6 | 14.3 | 28.8 | 25.5 | 38.8 | 36.0 | 38.5 | 38.4 | 47.5 | 34.1 | 28.5 | 22.6 | 36.0 |
| E2 | Condominium statusTable 1c Non-response rates per question, 2A-R questionnaire, Canada, provinces and territories, Census of Population, 2021 Note 2 |
38.1 | 28.3 | 19.0 | 29.7 | 26.2 | 41.3 | 37.9 | 41.0 | 40.1 | 49.5 | 35.7 | 29.2 | 25.0 | 37.8 |
| E3(a) | RoomsTable 1c Non-response rates per question, 2A-R questionnaire, Canada, provinces and territories, Census of Population, 2021 Note 2 |
36.5 | 27.4 | 16.7 | 28.6 | 25.8 | 38.8 | 36.3 | 38.8 | 38.7 | 47.8 | 34.6 | 30.3 | 22.7 | 36.5 |
| E3(b) | BedroomsTable 1c Non-response rates per question, 2A-R questionnaire, Canada, provinces and territories, Census of Population, 2021 Note 2 |
36.4 | 27.4 | 16.7 | 28.7 | 25.8 | 38.7 | 36.2 | 38.8 | 38.5 | 47.4 | 34.5 | 30.3 | 22.7 | 36.2 |
| E4 | Period of constructionTable 1c Non-response rates per question, 2A-R questionnaire, Canada, provinces and territories, Census of Population, 2021 Note 2 |
38.3 | 28.1 | 14.3 | 30.1 | 26.2 | 41.2 | 37.3 | 41.9 | 41.1 | 48.7 | 35.5 | 31.3 | 25.3 | 39.5 |
| E5 | Condition of dwellingTable 1c Non-response rates per question, 2A-R questionnaire, Canada, provinces and territories, Census of Population, 2021 Note 2 |
36.5 | 27.5 | 17.1 | 29.1 | 25.8 | 39.2 | 36.2 | 38.9 | 38.5 | 47.4 | 34.5 | 29.6 | 22.7 | 36.2 |
| E7(a) | Electricity paymentTable 1c Non-response rates per question, 2A-R questionnaire, Canada, provinces and territories, Census of Population, 2021 Note 3 |
39.4 | 29.6 | 15.0 | 30.9 | 26.9 | 42.2 | 38.7 | 44.0 | 41.4 | 50.0 | 37.2 | 34.2 | 25.1 | 38.9 |
| E7(b) | Fuel paymentTable 1c Non-response rates per question, 2A-R questionnaire, Canada, provinces and territories, Census of Population, 2021 Note 3 |
40.1 | 29.8 | 15.0 | 31.3 | 27.3 | 43.6 | 39.6 | 45.1 | 41.7 | 50.7 | 37.6 | 34.4 | 25.3 | 39.4 |
| E7(c) | Water and other service paymentTable 1c Non-response rates per question, 2A-R questionnaire, Canada, provinces and territories, Census of Population, 2021 Note 3 |
40.5 | 29.5 | 15.0 | 31.6 | 27.5 | 43.5 | 40.0 | 44.8 | 42.6 | 53.0 | 38.1 | 34.4 | 25.3 | 39.4 |
| E8(a) | RentTable 1c Non-response rates per question, 2A-R questionnaire, Canada, provinces and territories, Census of Population, 2021 Note 4 |
53.1 | 30.9 | 0.0 | 32.5 | 27.5 | 58.6 | 39.7 | 43.6 | 56.7 | 71.4 | 43.1 | 43.4 | 48.2 | 58.4 |
| E8(b) | Subsidy statusTable 1c Non-response rates per question, 2A-R questionnaire, Canada, provinces and territories, Census of Population, 2021 Note 4 |
55.8 | 30.6 | 0.0 | 43.1 | 28.7 | 63.9 | 42.4 | 49.0 | 59.9 | 76.3 | 46.7 | 43.1 | 48.9 | 59.2 |
| E9(a) | Mortgage paymentTable 1c Non-response rates per question, 2A-R questionnaire, Canada, provinces and territories, Census of Population, 2021 Note 5 |
37.1 | 22.8 | 37.5 | 43.8 | 30.9 | 37.5 | 36.0 | 50.1 | 41.5 | 59.0 | 36.1 | 34.5 | 26.0 | 38.6 |
| E9(b) | Property taxes included in mortgageTable 1c Non-response rates per question, 2A-R questionnaire, Canada, provinces and territories, Census of Population, 2021 Note 5 Table 1c Non-response rates per question, 2A-R questionnaire, Canada, provinces and territories, Census of Population, 2021 Note 6 |
40.5 | 28.6 | 20.0 | 57.1 | 36.5 | 44.6 | 38.9 | 55.7 | 44.4 | 78.0 | 38.6 | 38.3 | 30.8 | 40.0 |
| E9(c) | Property taxesTable 1c Non-response rates per question, 2A-R questionnaire, Canada, provinces and territories, Census of Population, 2021 Note 5 Table 1c Non-response rates per question, 2A-R questionnaire, Canada, provinces and territories, Census of Population, 2021 Note 7 |
39.4 | 23.7 | 26.8 | 45.0 | 33.3 | 41.1 | 37.3 | 53.3 | 45.5 | 58.5 | 37.9 | 34.7 | 29.5 | 42.8 |
| E9(d) | Value of dwellingTable 1c Non-response rates per question, 2A-R questionnaire, Canada, provinces and territories, Census of Population, 2021 Note 5 |
46.2 | 25.1 | 37.5 | 56.2 | 37.2 | 47.4 | 42.6 | 70.8 | 50.3 | 70.5 | 47.1 | 39.0 | 31.8 | 42.8 |
| E9(e) | Condominium feeTable 1c Non-response rates per question, 2A-R questionnaire, Canada, provinces and territories, Census of Population, 2021 Note 5 Table 1c Non-response rates per question, 2A-R questionnaire, Canada, provinces and territories, Census of Population, 2021 Note 8 |
37.6 | 100.0 | 100.0 | 0.0 | 100.0 | 66.7 | 37.5 | 65.4 | 47.5 | 86.7 | 30.4 | 71.4 | 32.5 | 34.7 |
| E10 | Monthly use or occupancy payment for dwellingTable 1c Non-response rates per question, 2A-R questionnaire, Canada, provinces and territories, Census of Population, 2021 Note 9 |
44.5 | 53.2 | 15.6 | 32.6 | 28.0 | 47.2 | 43.2 | 43.9 | 45.8 | 51.8 | 43.6 | 37.1 | 40.0 | Note ...: not applicable |
... not applicable
|
|||||||||||||||
Question-level imputation rates
Imputation rates per question largely reflect the non-response rates per question, and similar patterns are seen when differentiating between the 2A-L and 2A-R questionnaires. Overall, imputation rates per question were low for the housing content. The territories are an exception, where 2A-R questionnaires are used for collection in many areas.
| Question no. | Variable | Canada | N.L. | P.E.I. | N.S. | N.B. | Que. | Ont. | Man. | Sask. | Alta. | B.C. | Y.T. | N.W.T. | Nvt. |
|---|---|---|---|---|---|---|---|---|---|---|---|---|---|---|---|
| percent | |||||||||||||||
| 58 | Household maintainerTable 2a Imputation rates per question, Canada, provinces and territories, Census of Population, 2021 Note 1 |
2.5 | 2.1 | 1.7 | 1.9 | 2.3 | 2.1 | 2.2 | 3.2 | 3.2 | 3.2 | 2.7 | 5.4 | 11.0 | 26.4 |
| E1 | TenureTable 2a Imputation rates per question, Canada, provinces and territories, Census of Population, 2021 Note 2 |
2.8 | 2.1 | 2.0 | 2.2 | 2.8 | 2.4 | 2.5 | 3.9 | 4.1 | 3.6 | 2.9 | 7.7 | 12.5 | 36.0 |
| E2 | Condominium statusTable 2a Imputation rates per question, Canada, provinces and territories, Census of Population, 2021 Note 2 |
2.4 | 2.1 | 1.9 | 2.0 | 2.7 | 2.2 | 1.9 | 3.3 | 3.9 | 3.2 | 2.4 | 6.9 | 13.2 | 37.6 |
| E3(a) | RoomsTable 2a Imputation rates per question, Canada, provinces and territories, Census of Population, 2021 Note 2 |
5.0 | 4.5 | 3.8 | 4.0 | 4.6 | 3.9 | 4.8 | 5.7 | 5.8 | 6.1 | 6.6 | 11.1 | 14.6 | 39.1 |
| E3(b) | BedroomsTable 2a Imputation rates per question, Canada, provinces and territories, Census of Population, 2021 Note 2 |
3.2 | 2.5 | 2.3 | 2.6 | 3.2 | 2.7 | 3.0 | 4.2 | 4.4 | 4.1 | 3.6 | 8.0 | 12.9 | 36.6 |
| E4 | Period of constructionTable 2a Imputation rates per question, Canada, provinces and territories, Census of Population, 2021 Note 2 |
3.7 | 2.8 | 3.1 | 3.3 | 3.9 | 3.6 | 3.4 | 4.8 | 5.0 | 4.5 | 3.6 | 8.8 | 14.1 | 39.5 |
| E5 | Condition of dwellingTable 2a Imputation rates per question, Canada, provinces and territories, Census of Population, 2021 Note 2 |
2.9 | 2.3 | 2.2 | 2.4 | 3.0 | 2.7 | 2.6 | 3.8 | 4.1 | 3.7 | 3.0 | 7.4 | 12.4 | 36.2 |
| E7(a) | Electricity paymentTable 2a Imputation rates per question, Canada, provinces and territories, Census of Population, 2021 Note 3 |
6.8 | 5.4 | 5.8 | 5.6 | 6.6 | 5.5 | 6.8 | 8.4 | 9.8 | 8.5 | 7.1 | 12.6 | 16.2 | 40.7 |
| E7(b) | Fuel paymentTable 2a Imputation rates per question, Canada, provinces and territories, Census of Population, 2021 Note 3 |
6.5 | 5.6 | 5.8 | 5.6 | 6.6 | 5.5 | 6.3 | 8.4 | 9.6 | 8.3 | 6.7 | 12.7 | 16.0 | 41.3 |
| E7(c) | Water and other service paymentTable 2a Imputation rates per question, Canada, provinces and territories, Census of Population, 2021 Note 3 |
6.7 | 5.7 | 6.0 | 5.6 | 7.0 | 6.1 | 6.3 | 8.1 | 9.4 | 8.4 | 6.9 | 13.5 | 16.0 | 41.2 |
| E8(a) | RentTable 2a Imputation rates per question, Canada, provinces and territories, Census of Population, 2021 Note 4 |
5.4 | 4.9 | 4.8 | 4.9 | 6.1 | 4.7 | 5.5 | 6.2 | 6.8 | 6.5 | 5.3 | 11.8 | 18.7 | 40.2 |
| E8(b) | Subsidy statusTable 2a Imputation rates per question, Canada, provinces and territories, Census of Population, 2021 Note 4 |
5.5 | 4.5 | 5.0 | 4.9 | 6.2 | 4.7 | 5.4 | 6.2 | 7.2 | 6.7 | 5.3 | 12.0 | 28.9 | 39.0 |
| E9(a) | Mortgage paymentTable 2a Imputation rates per question, Canada, provinces and territories, Census of Population, 2021 Note 5 |
5.0 | 4.1 | 5.1 | 4.3 | 5.1 | 4.2 | 4.7 | 5.9 | 7.0 | 6.6 | 5.4 | 9.5 | 13.6 | 38.1 |
| E9(b) | Property taxes included in mortgageTable 2a Imputation rates per question, Canada, provinces and territories, Census of Population, 2021 Note 5 Table 2a Imputation rates per question, Canada, provinces and territories, Census of Population, 2021 Note 6 |
4.5 | 3.2 | 4.4 | 3.5 | 4.2 | 3.5 | 4.3 | 5.1 | 6.0 | 6.0 | 5.0 | 7.5 | 11.9 | 37.0 |
| E9(c) | Property taxesTable 2a Imputation rates per question, Canada, provinces and territories, Census of Population, 2021 Note 5 Table 2a Imputation rates per question, Canada, provinces and territories, Census of Population, 2021 Note 7 |
7.4 | 8.9 | 7.3 | 6.6 | 8.0 | 7.1 | 6.7 | 7.8 | 9.3 | 8.7 | 8.2 | 14.8 | 27.9 | 51.4 |
| E9(d) | Value of dwellingTable 2a Imputation rates per question, Canada, provinces and territories, Census of Population, 2021 Note 5 |
7.1 | 5.7 | 7.4 | 6.5 | 7.6 | 6.6 | 6.7 | 7.7 | 8.9 | 8.4 | 7.5 | 12.6 | 17.6 | 43.3 |
| E9(e) | Condominium feeTable 2a Imputation rates per question, Canada, provinces and territories, Census of Population, 2021 Note 5 Table 2a Imputation rates per question, Canada, provinces and territories, Census of Population, 2021 Note 8 |
15.2 | 27.8 | 30.9 | 16.7 | 33.2 | 16.3 | 14.0 | 14.5 | 12.9 | 12.7 | 17.2 | 20.0 | 17.3 | 43.5 |
| E10 | Monthly use or occupancy payment for dwellingTable 2a Imputation rates per question, Canada, provinces and territories, Census of Population, 2021 Note 9 |
44.8 | 53.2 | 18.8 | 33.2 | 28.3 | 47.5 | 43.6 | 44.2 | 46.1 | 52.1 | 44.0 | 38.5 | 40.0 | Note ...: not applicable |
... not applicable
Source: Statistics Canada, Census of Population, 2021. |
|||||||||||||||
| Question no. | Variable | Canada | N.L. | P.E.I. | N.S. | N.B. | Que. | Ont. | Man. | Sask. | Alta. | B.C. | Y.T. | N.W.T. | Nvt. |
|---|---|---|---|---|---|---|---|---|---|---|---|---|---|---|---|
| percent | |||||||||||||||
| 58 | Household maintainerTable 2b Imputation rates per question, 2A-L questionnaire, Canada, provinces and territories, Census of Population, 2021 Note 1 |
2.2 | 1.8 | 1.6 | 1.7 | 2.1 | 1.9 | 2.1 | 2.2 | 2.1 | 2.8 | 2.3 | 2.1 | 1.3 | Note ...: not applicable |
| E1 | TenureTable 2b Imputation rates per question, 2A-L questionnaire, Canada, provinces and territories, Census of Population, 2021 Note 2 |
2.4 | 1.8 | 2.0 | 2.0 | 2.5 | 2.2 | 2.3 | 2.5 | 2.6 | 3.1 | 2.5 | 2.5 | 1.6 | Note ...: not applicable |
| E2 | Condominium statusTable 2b Imputation rates per question, 2A-L questionnaire, Canada, provinces and territories, Census of Population, 2021 Note 2 |
2.0 | 1.8 | 1.8 | 1.8 | 2.4 | 2.0 | 1.8 | 2.1 | 2.4 | 2.8 | 2.0 | 2.2 | 1.3 | Note ...: not applicable |
| E3(a) | RoomsTable 2b Imputation rates per question, 2A-L questionnaire, Canada, provinces and territories, Census of Population, 2021 Note 2 |
4.7 | 4.2 | 3.7 | 3.8 | 4.4 | 3.7 | 4.6 | 4.6 | 4.4 | 5.7 | 6.2 | 6.6 | 3.9 | Note ...: not applicable |
| E3(b) | BedroomsTable 2b Imputation rates per question, 2A-L questionnaire, Canada, provinces and territories, Census of Population, 2021 Note 2 |
2.9 | 2.1 | 2.3 | 2.4 | 2.9 | 2.5 | 2.8 | 3.1 | 3.0 | 3.8 | 3.2 | 3.2 | 2.1 | Note ...: not applicable |
| E4 | Period of constructionTable 2b Imputation rates per question, 2A-L questionnaire, Canada, provinces and territories, Census of Population, 2021 Note 2 |
3.4 | 2.5 | 3.0 | 3.1 | 3.7 | 3.4 | 3.3 | 3.6 | 3.6 | 4.2 | 3.2 | 4.0 | 2.3 | Note ...: not applicable |
| E5 | Condition of dwellingTable 2b Imputation rates per question, 2A-L questionnaire, Canada, provinces and territories, Census of Population, 2021 Note 2 |
2.6 | 1.9 | 2.2 | 2.2 | 2.8 | 2.5 | 2.5 | 2.7 | 2.7 | 3.3 | 2.6 | 2.6 | 1.5 | Note ...: not applicable |
| E7(a) | Electricity paymentTable 2b Imputation rates per question, 2A-L questionnaire, Canada, provinces and territories, Census of Population, 2021 Note 3 |
6.5 | 5.0 | 5.8 | 5.4 | 6.3 | 5.3 | 6.7 | 7.2 | 8.3 | 8.1 | 6.7 | 7.4 | 5.5 | Note ...: not applicable |
| E7(b) | Fuel paymentTable 2b Imputation rates per question, 2A-L questionnaire, Canada, provinces and territories, Census of Population, 2021 Note 3 |
6.2 | 5.3 | 5.8 | 5.3 | 6.4 | 5.3 | 6.2 | 7.2 | 8.2 | 7.9 | 6.3 | 7.5 | 4.9 | Note ...: not applicable |
| E7(c) | Water and other service paymentTable 2b Imputation rates per question, 2A-L questionnaire, Canada, provinces and territories, Census of Population, 2021 Note 3 |
6.4 | 5.4 | 6.0 | 5.3 | 6.7 | 5.9 | 6.1 | 6.9 | 7.9 | 7.9 | 6.5 | 8.6 | 4.8 | Note ...: not applicable |
| E8(a) | RentTable 2b Imputation rates per question, 2A-L questionnaire, Canada, provinces and territories, Census of Population, 2021 Note 4 |
5.2 | 4.8 | 4.8 | 4.9 | 6.1 | 4.5 | 5.5 | 5.8 | 6.2 | 6.3 | 5.1 | 7.0 | 8.9 | Note ...: not applicable |
| E8(b) | Subsidy statusTable 2b Imputation rates per question, 2A-L questionnaire, Canada, provinces and territories, Census of Population, 2021 Note 4 |
5.2 | 4.3 | 5.0 | 4.9 | 6.2 | 4.5 | 5.4 | 5.9 | 6.4 | 6.5 | 5.2 | 6.1 | 5.0 | Note ...: not applicable |
| E9(a) | Mortgage paymentTable 2b Imputation rates per question, 2A-L questionnaire, Canada, provinces and territories, Census of Population, 2021 Note 5 |
4.9 | 3.9 | 5.0 | 4.3 | 5.1 | 4.2 | 4.6 | 5.7 | 6.8 | 6.5 | 5.1 | 5.4 | 2.6 | Note ...: not applicable |
| E9(b) | Property taxes included in mortgageTable 2b Imputation rates per question, 2A-L questionnaire, Canada, provinces and territories, Census of Population, 2021 Note 5 Table 2b Imputation rates per question, 2A-L questionnaire, Canada, provinces and territories, Census of Population, 2021 Note 6 |
4.4 | 3.1 | 4.4 | 3.5 | 4.2 | 3.5 | 4.3 | 5.1 | 5.8 | 5.9 | 4.8 | 4.9 | 2.9 | Note ...: not applicable |
| E9(c) | Property taxesTable 2b Imputation rates per question, 2A-L questionnaire, Canada, provinces and territories, Census of Population, 2021 Note 5 Table 2b Imputation rates per question, 2A-L questionnaire, Canada, provinces and territories, Census of Population, 2021 Note 7 |
7.3 | 8.5 | 7.3 | 6.5 | 8.0 | 7.0 | 6.6 | 7.4 | 9.0 | 8.6 | 7.9 | 9.1 | 5.1 | Note ...: not applicable |
| E9(d) | Value of dwellingTable 2b Imputation rates per question, 2A-L questionnaire, Canada, provinces and territories, Census of Population, 2021 Note 5 |
6.9 | 5.5 | 7.3 | 6.4 | 7.5 | 6.5 | 6.6 | 7.3 | 8.6 | 8.3 | 7.0 | 7.8 | 3.6 | Note ...: not applicable |
| E9(e) | Condominium feeTable 2b Imputation rates per question, 2A-L questionnaire, Canada, provinces and territories, Census of Population, 2021 Note 5 Table 2b Imputation rates per question, 2A-L questionnaire, Canada, provinces and territories, Census of Population, 2021 Note 8 |
15.2 | 27.8 | 30.7 | 16.7 | 33.2 | 16.2 | 14.0 | 14.5 | 12.8 | 12.7 | 17.1 | 19.6 | 15.8 | Note ...: not applicable |
| E10 | Monthly use or occupancy payment for dwellingTable 2b Imputation rates per question, 2A-L questionnaire, Canada, provinces and territories, Census of Population, 2021 Note 9 |
Note ...: not applicable | Note ...: not applicable | Note ...: not applicable | Note ...: not applicable | Note ...: not applicable | Note ...: not applicable | Note ...: not applicable | Note ...: not applicable | Note ...: not applicable | Note ...: not applicable | Note ...: not applicable | Note ...: not applicable | Note ...: not applicable | Note ...: not applicable |
... not applicable
Source: Statistics Canada, Census of Population, 2021. |
|||||||||||||||
| Question no. | Variable | Canada | N.L. | P.E.I. | N.S. | N.B. | Que. | Ont. | Man. | Sask. | Alta. | B.C. | Y.T. | N.W.T. | Nvt. |
|---|---|---|---|---|---|---|---|---|---|---|---|---|---|---|---|
| percent | |||||||||||||||
| 58 | Household maintainerTable 2c Imputation rates per question, 2A-R questionnaire, Canada, provinces and territories, Census of Population, 2021 Note 1 |
29.7 | 26.8 | 9.6 | 22.5 | 20.9 | 32.4 | 32.2 | 27.0 | 25.9 | 40.4 | 31.3 | 22.7 | 20.2 | 26.4 |
| E1 | TenureTable 2c Imputation rates per question, 2A-R questionnaire, Canada, provinces and territories, Census of Population, 2021 Note 2 |
40.3 | 28.3 | 21.4 | 31.3 | 28.4 | 41.8 | 38.8 | 49.2 | 43.5 | 51.5 | 38.8 | 31.8 | 22.9 | 36.0 |
| E2 | Condominium statusTable 2c Imputation rates per question, 2A-R questionnaire, Canada, provinces and territories, Census of Population, 2021 Note 2 |
37.7 | 28.0 | 19.0 | 29.1 | 25.8 | 40.9 | 37.1 | 40.7 | 40.1 | 49.2 | 35.2 | 29.1 | 24.5 | 37.6 |
| E3(a) | RoomsTable 2c Imputation rates per question, 2A-R questionnaire, Canada, provinces and territories, Census of Population, 2021 Note 2 |
38.4 | 28.9 | 16.7 | 29.7 | 26.6 | 40.7 | 37.6 | 41.3 | 40.1 | 49.1 | 36.9 | 32.1 | 24.7 | 39.1 |
| E3(b) | BedroomsTable 2c Imputation rates per question, 2A-R questionnaire, Canada, provinces and territories, Census of Population, 2021 Note 2 |
36.9 | 27.6 | 19.0 | 29.1 | 26.2 | 39.1 | 36.5 | 39.4 | 39.0 | 48.0 | 35.4 | 30.6 | 23.2 | 36.6 |
| E4 | Period of constructionTable 2c Imputation rates per question, 2A-R questionnaire, Canada, provinces and territories, Census of Population, 2021 Note 2 |
38.3 | 28.1 | 14.3 | 30.1 | 26.2 | 41.2 | 37.3 | 41.9 | 41.1 | 48.7 | 35.5 | 31.3 | 25.3 | 39.5 |
| E5 | Condition of dwellingTable 2c Imputation rates per question, 2A-R questionnaire, Canada, provinces and territories, Census of Population, 2021 Note 2 |
36.5 | 27.5 | 17.1 | 29.1 | 25.8 | 39.2 | 36.2 | 38.9 | 38.5 | 47.4 | 34.5 | 29.6 | 22.7 | 36.2 |
| E7(a) | Electricity paymentTable 2c Imputation rates per question, 2A-R questionnaire, Canada, provinces and territories, Census of Population, 2021 Note 3 |
41.7 | 30.9 | 16.9 | 38.6 | 35.7 | 43.6 | 40.3 | 47.0 | 44.7 | 52.7 | 38.5 | 36.9 | 26.5 | 40.7 |
| E7(b) | Fuel paymentTable 2c Imputation rates per question, 2A-R questionnaire, Canada, provinces and territories, Census of Population, 2021 Note 3 |
41.7 | 30.9 | 16.4 | 37.6 | 29.8 | 44.4 | 40.7 | 46.1 | 44.6 | 53.2 | 38.5 | 36.7 | 26.6 | 41.3 |
| E7(c) | Water and other service paymentTable 2c Imputation rates per question, 2A-R questionnaire, Canada, provinces and territories, Census of Population, 2021 Note 3 |
42.2 | 30.8 | 15.0 | 37.2 | 35.1 | 44.8 | 41.0 | 46.7 | 44.6 | 55.1 | 38.9 | 36.8 | 26.6 | 41.2 |
| E8(a) | RentTable 2c Imputation rates per question, 2A-R questionnaire, Canada, provinces and territories, Census of Population, 2021 Note 4 |
38.8 | 30.9 | 0.0 | 30.0 | 22.5 | 39.6 | 35.8 | 43.6 | 45.0 | 55.8 | 40.6 | 37.0 | 26.8 | 40.2 |
| E8(b) | Subsidy statusTable 2c Imputation rates per question, 2A-R questionnaire, Canada, provinces and territories, Census of Population, 2021 Note 4 |
50.2 | 30.6 | 0.0 | 43.1 | 28.7 | 64.0 | 42.5 | 49.3 | 60.0 | 76.5 | 46.7 | 43.4 | 48.9 | 39.0 |
| E9(a) | Mortgage paymentTable 2c Imputation rates per question, 2A-R questionnaire, Canada, provinces and territories, Census of Population, 2021 Note 5 |
37.0 | 22.8 | 37.5 | 42.7 | 30.9 | 37.5 | 36.0 | 50.1 | 41.3 | 57.8 | 36.1 | 33.9 | 25.7 | 38.1 |
| E9(b) | Property taxes included in mortgageTable 2c Imputation rates per question, 2A-R questionnaire, Canada, provinces and territories, Census of Population, 2021 Note 5 Table 2c Imputation rates per question, 2A-R questionnaire, Canada, provinces and territories, Census of Population, 2021 Note 6 |
38.4 | 26.7 | 20.0 | 53.6 | 36.5 | 42.8 | 36.6 | 54.3 | 42.8 | 76.4 | 36.4 | 38.0 | 28.1 | 37.0 |
| E9(c) | Property taxesTable 2c Imputation rates per question, 2A-R questionnaire, Canada, provinces and territories, Census of Population, 2021 Note 5 Table 2c Imputation rates per question, 2A-R questionnaire, Canada, provinces and territories, Census of Population, 2021 Note 7 |
44.4 | 38.8 | 26.8 | 45.0 | 34.8 | 42.1 | 38.5 | 53.7 | 50.0 | 78.8 | 38.7 | 43.8 | 51.6 | 51.4 |
| E9(d) | Value of dwellingTable 2c Imputation rates per question, 2A-R questionnaire, Canada, provinces and territories, Census of Population, 2021 Note 5 |
49.2 | 25.3 | 37.5 | 64.0 | 43.6 | 49.8 | 44.7 | 73.7 | 53.0 | 79.5 | 50.9 | 41.2 | 33.0 | 43.3 |
| E9(e) | Condominium feeTable 2c Imputation rates per question, 2A-R questionnaire, Canada, provinces and territories, Census of Population, 2021 Note 5 Table 2c Imputation rates per question, 2A-R questionnaire, Canada, provinces and territories, Census of Population, 2021 Note 8 |
48.1 | 100.0 | 100.0 | 100.0 | 100.0 | 94.9 | 68.8 | 92.3 | 82.5 | 93.3 | 35.5 | 85.7 | 50.0 | 43.5 |
| E10 | Monthly use or occupancy payment for dwellingTable 2c Imputation rates per question, 2A-R questionnaire, Canada, provinces and territories, Census of Population, 2021 Note 9 |
44.8 | 53.2 | 18.8 | 32.7 | 28.2 | 47.5 | 43.6 | 44.1 | 46.1 | 52.1 | 43.8 | 37.1 | 40.0 | Note ...: not applicable |
... not applicable
Source: Statistics Canada, Census of Population, 2021. |
|||||||||||||||
Higher levels of non-response and imputation per question are largely concentrated in remote areas, including reserves, rural communities and regions in the territories. Users are encouraged to consult the data quality indicators when conducting housing analysis at lower levels of geography where the population counts are small and there were substantial collection methodology changes from 2016.
Comparability
Processing changes
When the shelter cost and value of dwelling components of the housing content are processed, responses that are not considered to be part of the true distribution in the population are flagged as improbable, invalidated and imputed with a different response. These situations can occur because of erroneous responses or data capture errors. Each variable has its own range of values corresponding to the varying levels that are acceptable. The 2016 Census set maximum value thresholds for the shelter cost and value of dwelling variables by adjusting thresholds from the 2011 National Household Survey according to the corresponding Consumer Price Index basket component. These thresholds were applied nationally, except for the utility variables, which used separate thresholds to reflect higher costs in the territories.
This method of setting maximum value thresholds was changed for the 2021 Census to adopt a data-driven approach of defining regional distributions and thresholds. Nearly 8,000 regions with an acceptable number of responding households were assessed for outliers, from census tracts to provincial and territorial regions outside census metropolitan areas and census agglomerations. For the value of the dwelling, for example, the upper threshold was set much higher in Vancouver or Toronto census tracts than in rural areas, where the values of dwellings were lower. This new approach with regionally appropriate thresholds will allow for responses that were above the previous national threshold in neighbourhoods where house values are high, such as in Toronto and Vancouver. In regions where the prices are typically lower, this will allow responses below the previously used national threshold to be invalidated if they do not follow the local distribution.
Overall, the percentage of records that were flagged as outliers in 2021 was similar to that in 2016, but some places in Canada have more outliers than before, and others have fewer. As a result, the 2021 regional distributions are closer to what was reported. The change had little to no impact on the medians of the shelter cost and value of dwelling variables. However, when the mean is used, especially for the value of dwelling variable, growth from the 2016 Census for a small number of census subdivisions or census tracts may appear to be larger than expected.
Comparability of concepts over time
Most of the housing information in the 2021 Census of Population was collected in previous long-form census questionnaires. Over time, there have been differences in question wording, format, examples, and instructions given to enumerators and respondents. As a result, the historical comparability of some components of housing data has been affected by these factors.
Although the 2021 Census of Population housing questions were essentially the same as those from the 2016 long-form questionnaire, there were some differences and additions. The differences include the following.
2016 Census of Population
In 2021, on the 2A-R questionnaire, the first question collecting information on the tenure status of a household was modified to remove the response category of “band housing” and asked directly whether the dwelling was provided by the local government, First Nation or Indian band. This update reflects a change to the terminology, as Statistics Canada no longer uses the term “band housing.”
Overall, the proportion of households whose dwelling was provided by the local government, First Nation or Indian band rose by 9.5 percentage points. Growth in the share of this tenure category occurred in nearly every province, except Prince Edward Island, and users should consider the changes to the way the question was posed when making historical comparisons of the composition of dwellings on reserves by tenure.
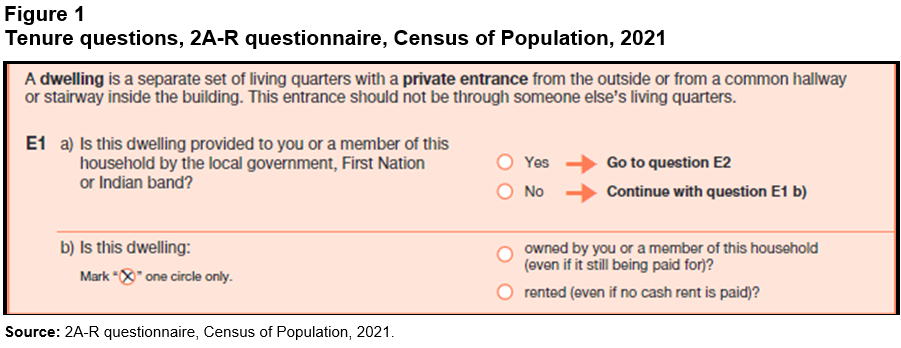
Description for Figure 1
The title of this figure is “Tenure questions, 2A-R questionnaire, Census of Population, 2021.”
This figure is a screenshot of the 2021 2A-R census questionnaire containing questions E1 a) and b).
The text reads, “A dwelling is a separate set of living quarters with a private entrance from the outside or from a common hallway or stairway inside the building. This entrance should not be through someone else's living quarters.”
Question E1 a) asks, “Is this dwelling provided to you or a member of this household by the local government, First Nation or Indian band?”
To the right of the question text, there are two radio buttons where respondents select their answer. The options are:
- Yes (if selected, respondents are prompted to go to question E2)
- No (if selected, respondents are prompted to continue with question E1 b)).
Question E1 b) begins with, “Is this dwelling.” The text continues, “Mark ‘X’ in one circle only.”
To the right of the question text, there are two radio buttons where respondents select their answer. The options are:
- owned by you or a member of this household (even if it still being paid for)
- rented (even if no cash rent is paid).
Source: 2A-R questionnaire, Census of Population, 2021.
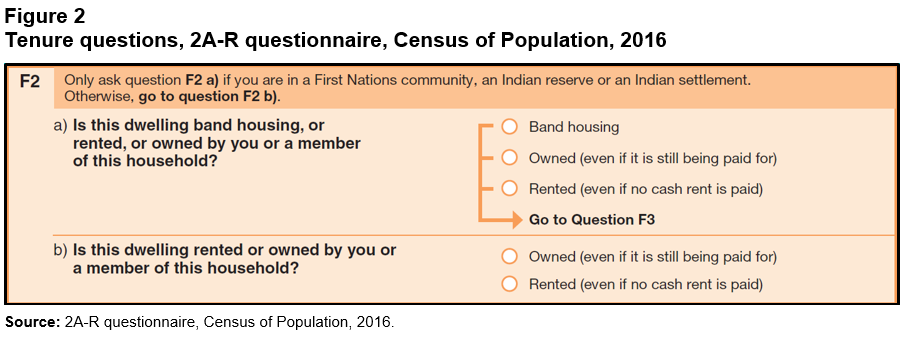
Description for Figure 2
The title of this figure is “Tenure questions, 2A-R questionnaire, Census of Population, 2016.”
This figure is a screenshot of the 2016 2A-R census questionnaire containing questions F2 a) and b).
The text reads, “Only ask question F2 a) if you are in a First Nations community, an Indian reserve or an Indian settlement. Otherwise, go to question F2 b).”
Question F2 a) asks, “Is this dwelling band housing, or rented, or owned by you or a member of this household?”
To the right of the question text, there are three radio buttons where respondents select their answer. The options are:
- Band housing
- Owned (even if it is still being paid for)
- Rented (even if no cash rent is paid).
If any of these radio buttons are selected, respondents are prompted to go to Question F3.
Question F2 b) asks, “Is this dwelling rented or owned by you or a member of this household?”
To the right of the question text, there are two radio buttons where respondents select their answer. The options are:
- Owned (even if it is still being paid for)
- Rented (even if no cash rent is paid).
Source: 2A-R questionnaire, Census of Population, 2016.
Shelter cost for households living in dwellings provided by the local government, First Nation or Indian band
Starting in 2021, information about monthly payments for the use or occupancy of dwellings provided by the local government, First Nation or Indian band was collected. The shelter cost for households living in these dwellings can now be derived using responses from the new Question E10 on the 2A-R questionnaire (see Concepts over time). In previous census cycles, only information about utility payments was collected for these households.
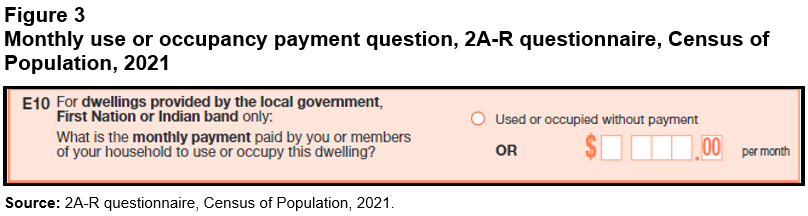
Description for Figure 3
The title of this figure is “Monthly use or occupancy payment question, 2A-R questionnaire, Census of Population, 2021.”
This figure is a screenshot of the 2021 2A-R census questionnaire containing question E10.
Question E10 asks, “For dwellings provided by the local government, First Nation or Indian band only: What is the monthly payment paid by you or members of your household to use or occupy this dwelling?”
To the right of the question text, respondents can either select a radio button with the statement “Used or occupied without payment” or they can enter the dollar amount per month using an edit field.
Source: 2A-R questionnaire, Census of Population, 2021.
Household maintainer status
In 2021, the household maintainer question was asked for every member of the household aged 15 years or older. Previously, in 2016, the question had a mark-all-that-apply format for the first five persons listed on the paper questionnaire. This alteration to the paper questionnaire brings better visual resemblance between the electronic and paper questionnaires. The wording was also modified to include a qualifying statement of “partly or entirely” when referring to the payments. The result of these changes is the capture of more household maintainers who are not the primary household maintainer.
The growth rate of the number of primary household maintainers since the 2016 Census of Population was 6.4%, the same as the growth rate of private occupied dwellings, because every private occupied dwelling has one primary maintainer. At the same time, the growth rate of other household maintainers over the same period was 34.1%, indicating more comprehensive coverage of all household maintainers. This has not affected the characteristics of the primary household maintainer, which are often used to derive statistics such as the homeownership rates of different generations. However, the more complete coverage of other maintainers will allow for future analysis of the characteristics of these other household members contributing to housing payments.
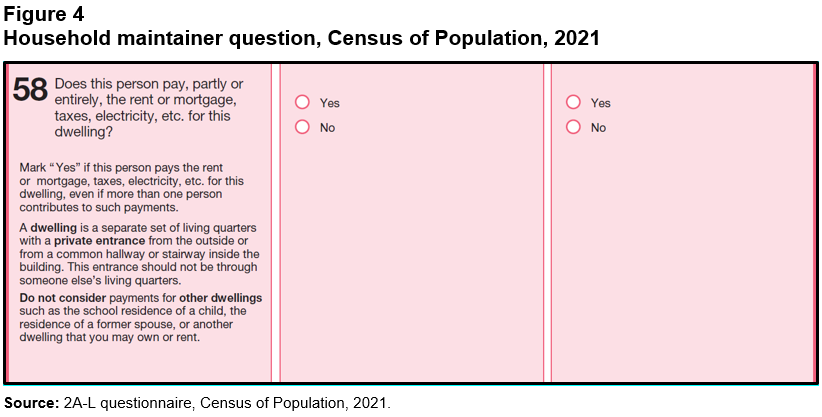
Description for Figure 4
The title of this figure is “Household maintainer question, Census of Population, 2021.”
This figure is a screenshot of the 2021 2A-L census questionnaire containing question 58.
Question 58 asks, “Does this person pay, partly or entirely, the rent or mortgage, taxes, electricity, etc. for this dwelling?”
The text continues, “mark ‘Yes’ if this person pays the rent or mortgage, taxes, electricity, etc. for this dwelling, even if more than one person contributes to such payments.”
The text then reads, “A dwelling is a separate set of living quarters with a private entrance from the outside or from a common hallway or stairway inside the building. This entrance should not be through someone else’s living quarters.”
The text continues, “Do not consider payments for other dwellings such as the school residence of a child, the residence of a former spouse, or another dwelling that you may own or rent.”
To the right of the question text, there are two columns for two respondents, and each column has two radio buttons where respondents can select their answer. The options are:
- Yes
- No.
Source: 2A-L questionnaire, Census of Population, 2021.
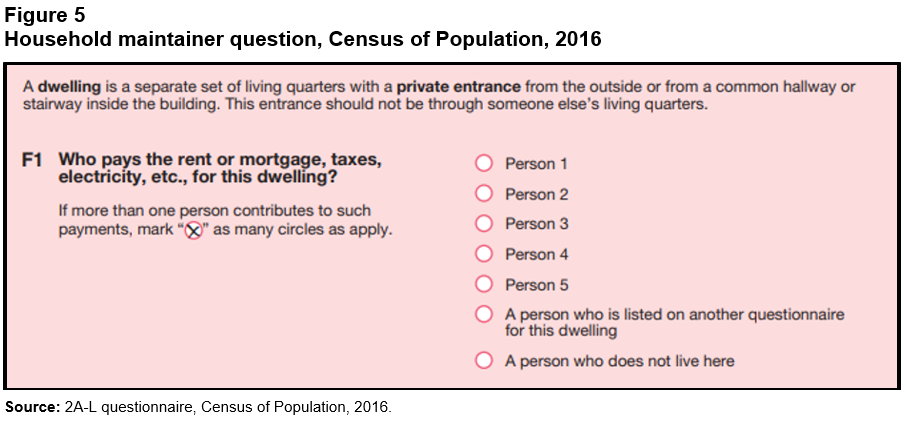
Description for Figure 5
The title of this figure is “Household maintainer question, Census of Population, 2016.”
This figure is a screenshot of the 2016 census questionnaire containing question F1.
The text reads, “A dwelling is a separate set of living quarters with a private entrance from the outside or from a common hallway or stairway inside the building. This entrance should not be through someone else’s living quarters.”
Question F1 asks, “Who pays the rent or mortgage, taxes, electricity, etc., for this dwelling?” The text continues, “If more than one person contributes to such payments, mark ‘X’ as many circles as apply.”
To the right of the question text, there are seven radio buttons where respondents select their answer. The options are:
- Person 1
- Person 2
- Person 3
- Person 4
- Person 5
- A person who is listed on another questionnaire for this dwelling
- A person who does not live here.
Source: 2A-L questionnaire, Census of Population, 2016.
Comparability with other data sources
Statistics Canada produces a range of housing data from various sources for different uses. Comparability of housing data across data sources is affected by differences in survey target populations or administrative sources, survey sampling and collection methodologies; survey objectives, question wording, format, examples and instructions; approaches to data processing; the social and political climate at the time of data collection; and other factors.
As with every survey, the quality of the Census of Population housing information released was evaluated internally prior to publication. The data were compared, as much as possible, with alternative data sources. The main Statistics Canada sources of comparison were the Canadian Income Survey (CIS), the Canadian Housing Survey (CHS), the Canadian Housing Statistics Program (CHSP) and the Survey of Household Spending (SHS).
2021 Canadian Housing Survey, 2020 Canadian Income Survey and 2019 Survey of Household Spending
Like the census, the CHS, CIS and SHS also include questions on housing. Generally, statistics from these three surveys and the census are comparable, taking into account sampling variability. However, differences in question wording, question order, collection method, target population and reference period (resulting from different collection times within the year) mean that the results are not expected to be identical. Furthermore, where differences were observed, comparisons of data from the CIS and SHS with data from the 2016 Census of Population showed similar differences—suggesting an impact because of methodological differences that have been present throughout the years. Table 3 below contains selected housing statistics at the national level for each of the surveys.
The CHS, CIS and SHS also collect data on the condominium status of the dwelling. However, estimates of the proportion of condominiums based on these surveys have high sampling variability. Furthermore, the CIS captures the condominium status for owner-occupied dwellings only, while the SHS captures it for owner-occupied and tenant-occupied condominiums.
Shelter costs, shelter-cost-to-income ratio groups and core housing need statistics are comparable across the three sources. While owners’ shelter cost payments are higher in the SHS, the estimate does not follow the same pattern as the other three sources, indicating that these differences may have been introduced by differences in the reference periods or data quality issues unique to the 2019 SHS. The census and CHS rates for subsidized rental housing are comparable, while the CIS rate is lower owing to high sampling variability.
| Housing indicator | 2021 Census | 2021 Census, adjustedTable 3 Note 1 | 2021 Canadian Housing SurveyTable 3 Note 1 | 2020 Canadian Income SurveyTable 3 Note 1 | 2019 Survey of Household Spending |
|---|---|---|---|---|---|
| Count of households | 14,978,940 | 14,817,770 | 15,067,800Table 3 Note 2 | 15,056,000Table 3 Note 2 | 14,707,000 |
| Percentage of owner households | 66.5 | 66.8 | 67.8 | 67.1 | 66.8 |
| Percentage of households in core housing need | 10.1 | 10.1 | 9.8 | 10.1 | Note ...: not applicable |
| Percentage of households that paid 30% or more of household total income towards shelter costs | 20.9 | 21.0 | 19.5 | 20.9 | 19.6 |
| Owner households | 14.8 | 14.8 | 14.3 | 14.1 | 12.4 |
| Renter households | 33.2 | 33.2 | 30.3 | 34.6 | 34.1 |
| Percentage of households in unsuitable housing | 5.4 | 5.3 | 4.8 | 5.4 | 5.7 |
| Percentage of households in dwellings in need of major repairs | 6.1 | 5.9 | 7.4 | 6.1 | 7.9 |
| Average owner-estimated value ($) | 617,500 | 619,000 | Note ..: not available for a specific reference period | Note ..: not available for a specific reference period | 523,230 |
| Average shelter cost ($/month) | 1,394 | 1,402 | 1,370 | 1,400 | 1,683 |
| Owner households ($) | 1,494 | 1,498 | 1,470 | 1,500 | 1,923 |
| Renter households ($) | 1,209 | 1,210 | 1,160 | 1,200 | 1,199 |
| Percentage of households in condominiums | 15.0 | 15.1 | 13.7 | 12.2 | Note ..: not available for a specific reference period |
| Percentage of households in subsidized housingTable 3 Note 3 | 11.7 | 11.6 | 11.3 | 5.4 | Note ..: not available for a specific reference period |
|
.. not available for a specific reference period ... not applicable
|
|||||
2020 Canadian Housing Statistics Program and 2021 Multiple Listing Service©
Two other sources that report on values of dwellings are Statistics Canada’s CHSP and the Canadian Real Estate Association’s Multiple Listing Service© (MLS). The 2021 MLS reported similar average values of dwellings as the 2021 Census of Population, with slightly lower average values in the Prairie provinces and slightly higher values in the rest of Canada. A key conceptual difference to consider is that the MLS data represent dwellings that were sold over the reference period, while the Census of Population takes a broader scope and asks all homeowner households to report the expected price they would receive if they were to sell their dwelling. That the estimates are close is an indication that homeowners are aware of their local real estate market conditions.
The CHSP average values were consistently below average sale prices from the MLS and average owner-estimated values in the Census of Population, except in the Northwest Territories, owing mainly to conceptual differences. These CHSP values are based on property assessment rolls for the purpose of taxation, and the frequency of reassessments is based on provincial and territorial legislation. As a consequence, these values may be updated yearly or less frequently depending on the jurisdiction.
| Geography | 2021 Census | 2021 Multiple Listing Service© | 2020 Canadian Housing Statistics Program |
|---|---|---|---|
| Average value of dwelling ($) | Average sale price ($) | Average assessed value ($) | |
| Canada | 618,500 | 688,113 | Note ..: not available for a specific reference period |
| Newfoundland and Labrador | 246,800 | 273,350 | Note ..: not available for a specific reference period |
| Prince Edward Island | 313,200 | 341,623 | Note ..: not available for a specific reference period |
| Nova Scotia | 295,600 | 358,607 | 186,000 |
| New Brunswick | 207,800 | 246,467 | 139,000 |
| Quebec | 376,800 | 447,952 | Note ..: not available for a specific reference period |
| Ontario | 807,000 | 871,876 | 450,000 |
| Manitoba | 338,800 | 333,841 | 260,000 |
| Saskatchewan | 324,400 | 301,469 | Note ..: not available for a specific reference period |
| Alberta | 448,800 | 428,195 | Note ..: not available for a specific reference period |
| British Columbia | 983,000 | 927,558 | 740,000 |
| Yukon | 488,800 | 521,439 | 197,000 |
| Northwest Territories | 385,200 | 442,953 | Note ..: not available for a specific reference period |
| Nunavut | 410,800 | Note ..: not available for a specific reference period | Note ..: not available for a specific reference period |
|
.. not available for a specific reference period Note: Current dollars. Sources: Statistics Canada, 2021 Census of Population and 2020 Canadian Housing Statistics Program; and Canadian Real Estate Association, 2021 Multiple Listing Service©. |
|||
2020 Canadian Housing Statistics Program
Counts of condominiums reported in the Census of Population are usually larger than the CHSP counts of condominium apartments. While the definitions of these two variables are very similar, there are conceptual differences that cause the counts in the two sources to differ.
| Geography | 2021 Census of Population | 2020 Canadian Housing Statistics Program | |
|---|---|---|---|
| Total—condominium households | Condominium households in apartmentsTable 5 Note 1 | Condominium apartments | |
| St. John'sTable 5 Note 2 Table 5 Note 3 | 3,130 | 2,160 | 2,025 |
| Nova Scotia | 16,135 | 11,330 | 11,905 |
| New Brunswick | 13,170 | 7,130 | 2,100 |
| Ontario | 822,775 | 577,870 | 557,630 |
| Manitoba | 41,705 | 28,030 | 22,810 |
| British Columbia | 482,760 | 391,395 | 366,270 |
| Yukon | 2,055 | 570 | 480 |
|
|||
Notes
The Guide to the Census of Population, 2021, Statistics Canada Catalogue no. 98-304-X, describes the data quality assessments that all variables underwent. Generally, the numerous indicators used to evaluate the quality of the housing data supported the reliability of the data at the national, provincial and territorial levels, but they also identified the following items.
Question E1 on housing tenure
When the 2021 Census and the 2020 CIS were compared, it was observed that the homeownership rate is lower for the census, with statistical significance, in all provinces except Prince Edward Island. Differences in estimates range from 0.3% to 0.8%, except for Manitoba and Saskatchewan. The difference is 2.1% for Manitoba (67.4% for the census versus 69.5% for the CIS) and 2.5% for Saskatchewan (70.7% for the census versus 73.2% for the CIS).
When the 2021 Census and the 2020 CHS are compared, the estimates of the homeownership rate are very similar. There are no statistical differences in estimates nationally, provincially and territorially.
Question E2 on condominium status
The national rate of owner households in condominiums for the 2021 Census, at 14.3%, is higher than the CIS rate of 11.5%, a statistically significant difference. The condominium ownership rate is higher in the census than in the CIS in Quebec (13.0% for the census versus 10.1% for the CIS), Ontario (14.9% for the census versus 11.4% for the CIS), Manitoba (7.7% for the census versus 6.0% for the CIS) and Alberta (14.8% for the census versus 11.6% for the CIS). Other provinces did not have statistically different rates between the census and the CIS.
The 2021 Census estimate for the rate of owner households in condominiums was higher nationally compared with the CHS estimate, with statistical significance (14.3% for the census versus 12.3% for the CHS). This was also the case in Saskatchewan (9.6% for the census versus 7.7% for the CHS). Other provinces and territories had no statistical differences in estimates between the census and the CHS.
Question E3 on the number of rooms and bedrooms
A large proportion of dwellings with a small number of rooms and bedrooms, most often dwellings with one or two rooms, were affected by respondent reporting errors. The respondent reporting errors appeared in the form of inconsistencies between answers to two questions: the number of rooms and the number of bedrooms. These inconsistencies account for 2.4% of all households.
Respondent errors could occur for any number of reasons, such as forgetting to include bedrooms in the count of rooms or erroneously counting some rooms as bedrooms. These errors were resolved during data processing using rules that ultimately chose one of the two conflicting variables and then imputed the other variable.
The level of inconsistency between the number of rooms and bedrooms prior to processing was approximately 51% of responses for one-room dwellings and 7% for two-room dwellings. These rates are lower than the levels observed for the 2016 Census (62% for one-room dwellings and 9% for two-room dwellings) and the 2011 National Household Survey (80% for one-room dwellings and 20% for two-room dwellings). The electronic questionnaire has soft edits and prompts in place that signal whether responses are invalid to help reduce reporting errors. Households that reported their dwelling had more than one or two rooms were not significantly impacted by the data processing edits. This was also the case in prior censuses.
Question E4 on the period of construction
The Building Permits Survey (BPS) provides data on building permits by year, which can provide a good indication of the period of construction. However, BPS and census housing data are not always expected to be exactly coherent. Data on new residential units from the BPS account only for growth in dwellings, while the census reports period of construction data for occupied private dwellings.
Question E5 on the condition of the dwelling
When owners and renters were examined together, the proportion of households living in dwellings that required major repairs estimated by the 2021 Census of Population was similar with 2021 CIS estimates. A comparison of the two surveys did not show any statistically significant differences nationally or for any province. However, some statistically significant differences exist when looking at owners or renters individually.
For owners, the 2021 Census estimate was lower, with statistical significance, nationally (5.3% for the census versus 6.0% for the CIS) and for Ontario (4.7% for the census versus 5.4% for the CIS) and British Columbia (5.1% for the census versus 7.0% for the CIS). For renters, the 2021 Census estimate was higher, with statistical significance, nationally (7.2% for the census versus 6.2% for the CIS) and for Prince Edward Island (8.3% for the census versus 5.8% for the CIS) and Manitoba (7.3% for the census versus 4.6% for the CIS).
When the 2021 Census estimates were compared with the 2020 CHS estimates, no statistical differences existed at the provincial and territorial level. The census estimates were lower than the CHS estimates, with statistical significance, at the national level for all households (5.9% for the census versus 7.4% for the CHS), owner households (5.3% for the census versus 6.5% for the CHS) and renter households (7.2% for the census versus 9.3% for the CHS).
- Date modified: