
Sampling and Weighting Technical Report, Census of Population, 2021
5. Evaluation of the weighting procedures
As described in Chapter 4, the first step in weighting the long-form sample was to assign design weights to households. Weights were assigned differently depending on the collection method of the area where the household was located. Private households attached to a collective dwelling or part of a First Nations community, Métis settlement, Inuit region, or other remote area have a design weight of 1. The final weight for these private households corresponds to the design weight and remains at the initial value of 1. All the other private households have a design weight greater than 1. All of the results presented in this chapter were calculated for the subset of households with a design weight greater than 1.
In short, each household was assigned a design weight that was determined by the long-form sample design. Some adjustments were then necessary to address coverage and total non‑response. Non‑linear calibration was performed during this adjustment to estimate the parameters for non‑response models. After being adjusted for coverage and total non‑response, the weights were adjusted further in the final calibration process to produce the final weights. The final weights enabled generally better agreement between the census counts and the long-form estimates.
The next few sections examine the distribution of the weights and, for various characteristics, the discrepancies between the census counts and the sample.
5.1 Distribution of the weights
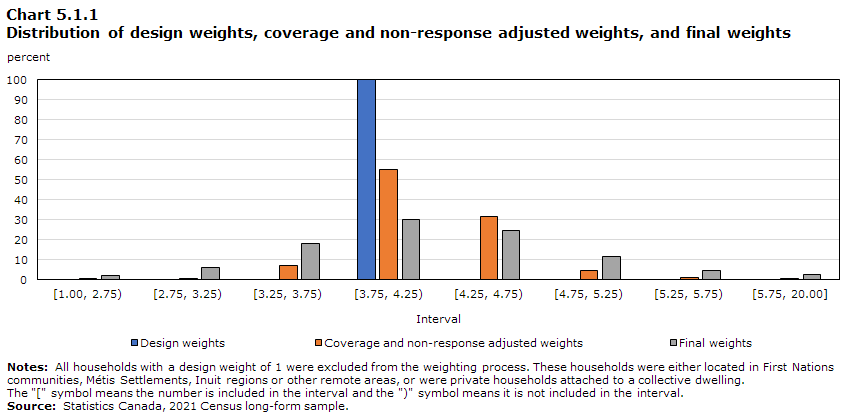
Chart 5.1.1 and tables 5.1.1 and 5.1.2 illustrate the distribution of the design weights, the weights adjusted for coverage and non‑response, and the weights adjusted in the final calibration. The weights are grouped by 0.5 length intervals, apart from the first and last intervals. The chart shows the percentage of times the weights appear in each interval. All the design weights ranged from 3.75 to 4.25. This is because of the long-form sample design, in which approximately one in four households received a long‑form questionnaire in most areas. The impact on the weights of the coverage and non‑response adjustments and the final calibration adjustments can also be seen. A very noticeable difference is shown in the 3.75 to 4.25 interval. In fact, 55% of households had their coverage and non‑response adjusted weights between 3.75 and 4.25 compared with 100% of design weights in this interval. After the final calibration adjustment only 30% of households had their final weights in this interval. The final weights were more evenly distributed across all categories compared with the design and coverage and non‑response adjusted weights.
Logically, the non‑response adjustment process should tend to increase the weights to compensate for the non‑responding units. This did occur for most cases. The changes between the design weights and the coverage and non‑response adjusted weights can be observed in Table 5.1.1. This table shows that most of the units that left the [3.75, 4.25) range moved to the [4.25, 4.75) or [4.75, 5.25) ranges. However, the coverage and non‑response adjustment process also moved some weights from the [3.75, 4.25) range to the [1.00, 2.75), [2.75, 3.25) or [3.25, 3.75) ranges for some units. The main reason is that the procedure included an adjustment for overcoverage and undercoverage. To the extent that a few population groups may have experienced overcoverage, the weights would have been reduced in those areas.
An important element to notice in Table 5.1.1 is that the non‑responding units originally had positive weights, since they were selected for the sample. The non‑response adjustment process assigned them a weight of 0 and redistributed their original weights among responding units. The non‑responding units correspond to the line labelled “0 (non‑respondents)” in Table 5.1.1 and were removed from Table 5.1.2, since they were not used in the calibration process. Table 5.1.2 presents the changes between the coverage and non‑response adjusted weights and the calibrated weights.
According to Table 5.1.2, most weights experienced only a small modification during the calibration process. In fact, 78.1% of cases either stayed in the same range or moved only one range up or down. The most stable range was 1.00 to 2.75, where 64% of the households with a coverage and non‑response adjusted weight between 1.00 and 2.75 stayed in that category after calibration. The second most stable category was 5.75 to 12.25 where 61.9% of households with a coverage and non‑response adjusted weight between 5.75 and 12.25 stayed in that category (although the calibration range goes up to 20.00 rather than 12.25).
Finally, whereas the coverage and non‑response adjusted weights varied from 1.00 to 12.25, the range of the final weights was from 1.00 to 20.00.
Data table for Chart 5.1.1
| Interval | Design weights | Coverage and non-response adjusted weights | Final weights |
|---|---|---|---|
| percent | |||
| [1.00, 2.75) | 0.00 | 0.04 | 2.17 |
| [2.75, 3.25) | 0.00 | 0.41 | 6.18 |
| [3.25, 3.75) | 0.00 | 7.13 | 17.94 |
| [3.75, 4.25) | 100.00 | 55.05 | 30.05 |
| [4.25, 4.75) | 0.00 | 31.66 | 24.76 |
| [4.75, 5.25) | 0.00 | 4.56 | 11.73 |
| [5.25, 5.75) | 0.00 | 0.83 | 4.45 |
| [5.75, 20.00] | 0.00 | 0.32 | 2.73 |
|
Notes: All households with a design weight of 1 were excluded from the weighting process. These households either were located in First Nations communities, Métis Settlements, Inuit regions or other remote areas, or were private households attached to a collective dwelling. The "[" symbol means the number is included in the interval and the ")" symbol means it is not included in the interval. Source: Statistics Canada, 2021 Census long-form sample. |
|||
| Coverage and non-response adjusted weights | Design weights | |
|---|---|---|
| [3.75, 4.25) | Total | |
| 0 (non-respondents) | 149,945 | 149,945 |
| [1.00, 2.75) | 1,555 | 1,555 |
| [2.75, 3.25) | 14,575 | 14,575 |
| [3.25, 3.75) | 252,583 | 252,583 |
| [3.75, 4.25) | 1,949,875 | 1,949,875 |
| [4.25, 4.75) | 1,121,300 | 1,121,300 |
| [4.75, 5.25) | 161,359 | 161,359 |
| [5.25, 5.75) | 29,512 | 29,512 |
| [5.75, 20.00] | 11,441 | 11,441 |
| Total | 3,692,145 | 3,692,145 |
|
Notes: All households with a design weight of 1 were excluded from the weighting process. These households either were located in First Nations communities, Métis Settlements, Inuit regions or other remote areas, or were private households attached to a collective dwelling. The "[" symbol means the number is included in the interval and the ")" symbol means it is not included in the interval. Source: Statistics Canada, 2021 Census long-form sample. |
||
| Final weights | Coverage and non-response adjusted weights | ||||||||
|---|---|---|---|---|---|---|---|---|---|
| [1.00, 2.75) | [2.75, 3.25) | [3.25, 3.75) | [3.75, 4.25) | [4.25, 4.75) | [4.75, 5.25) | [5.25, 5.75) | [5.75, 12.25) | Total | |
| [1.00, 2.75) | 999 | 4,045 | 19,737 | 38,100 | 11,595 | 1,706 | 364 | 174 | 76,720 |
| [2.75, 3.25) | 350 | 4,559 | 47,337 | 131,632 | 31,612 | 2,910 | 395 | 115 | 218,910 |
| [3.25, 3.75) | 144 | 3,710 | 84,405 | 426,528 | 111,790 | 7,757 | 909 | 193 | 635,436 |
| [3.75, 4.25) | 42 | 1,527 | 65,228 | 690,146 | 286,261 | 18,837 | 1,895 | 394 | 1,064,330 |
| [4.25, 4.75) | 13 | 514 | 25,637 | 451,501 | 359,080 | 36,037 | 3,507 | 678 | 876,967 |
| [4.75, 5.25) | 6 | 151 | 7,430 | 154,852 | 205,139 | 41,044 | 5,725 | 1,166 | 415,513 |
| [5.25, 5.75) | 1 | 45 | 2,020 | 42,165 | 77,392 | 28,209 | 6,127 | 1,642 | 157,601 |
| [5.75, 20.00] | 0 | 24 | 789 | 14,951 | 38,431 | 24,859 | 10,590 | 7,079 | 96,723 |
| Total | 1,555 | 14,575 | 252,583 | 1,949,875 | 1,121,300 | 161,359 | 29,512 | 11,441 | 3,542,200 |
|
Notes: All households with a design weight of 1 were excluded from the weighting process. These households either were located in First Nations communities, Métis Settlements, Inuit regions or other remote areas, or were private households attached to a collective dwelling. The "[" symbol means the number is included in the interval and the ")" symbol means it is not included in the interval. Source: Statistics Canada, 2021 Census long-form sample. |
|||||||||
5.2 Discrepancies between census counts and long-form estimates, Canada
Chapter 4 describes the methods used to calculate the final household weights, and Section 5.1 shows some of the relationships between design weights, coverage and non‑response adjusted weights and final weights. The coverage and non‑response adjustment reduced the discrepancies between the census counts and the corresponding long-form estimates for the constraints considered (see Appendix C). Following those adjustments, calibration further reduced or eliminated those discrepancies for certain variables (constraints). However, some discrepancies remain, since constraints are sometimes excluded. The relative difference between census counts and long-form estimates, called the discrepancy, is defined as:
This ratio represents the percentage that the characteristic was overestimated (a positive value) or underestimated (a negative value). For comparison reasons, it is also useful to look at the absolute values of the discrepancy and difference, hereafter referred to as the absolute discrepancy and absolute difference, respectively.
Table 5.2.1 shows the 2021 Canada-level differences between census counts and long-form estimates for the constraints considered for the design weights, the coverage and non‑response adjusted weights and the final weights.
Table 5.2.1 also shows the discrepancy for estimates based on final weights. Looking at these discrepancies sheds more light on the differences. Over 94% of the cases in Table 5.2.1 had a discrepancy from -1% to 1%, and over 99.5% of them had discrepancies ranging from -5% to 5%.
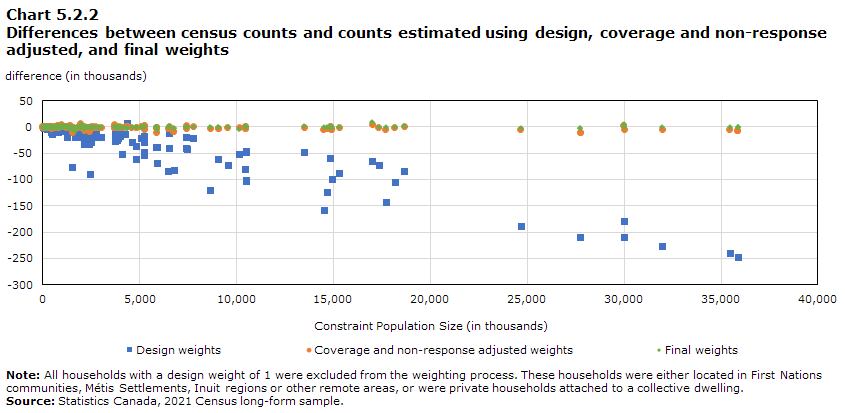
Chart 5.2.2 shows, for all the constraints, the difference between the census counts and each of the three estimates: design weights (blue), coverage and non‑response adjusted weights (orange), and final weights (green). The x-axis represents the population size of the constraint, in thousands, and the three series of dots show for each constraint:
- the difference between the sum of the design weights and the census count
- the difference between the sum of the coverage and non‑response adjusted weights and the census count
- the difference between the sum of the final weights and the census count.
The constraints are sorted, from left to right, by increasing population size.
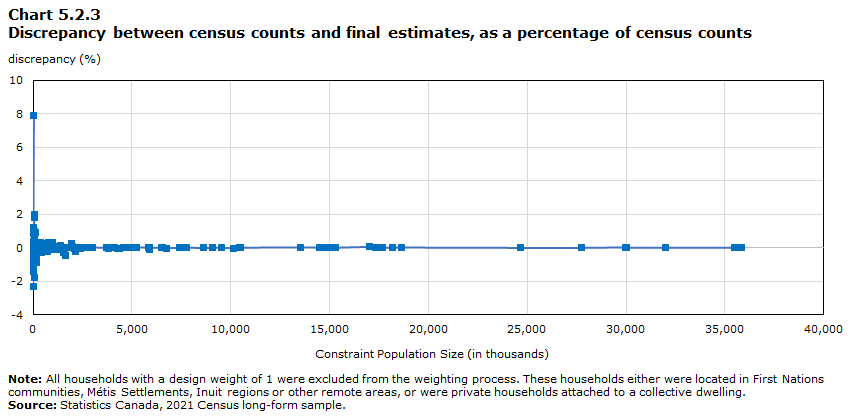
Chart 5.2.3 shows the percentage discrepancies between census counts and final estimates for all the constraints by population size. For the medium-sized and large-sized constraints, the discrepancies are all small. Only certain small-sized constraints have relatively large discrepancies.
The most important observation from Chart 5.2.2 is that the coverage and non‑response adjustment carries a big improvement over the design-weighted estimates, in terms of reducing the discrepancy. Although it is not apparent in the chart, the coverage adjustment does most of the job. The difference between census counts and long-form estimates for design weights tended to be (much) greater than the difference between census counts and long-form estimates for the coverage and non‑response adjusted weights. This, in turn, tended to be greater than the corresponding difference using the final weights. This shows the importance of the non‑response adjustment and calibration processes. A difference between the census count and long-form estimate could occur in a SADA or ADA for a characteristic if its constraint is excluded during calibration. In other words, the process did not control on the excluded constraint for a given area. If the constraint is excluded in many areas, these differences could partially cancel each other out, or they could cumulate to create a large difference at the Canada level. Total persons (TOTPERS) and total households (TOTHHLD) were the only mandatory constraints for which agreement between census counts and long-form estimates had to be guaranteed for all ADAs. As a result, the final weight difference and discrepancy for these characteristics were 0. However, all other constraints had to be excluded in some areas.
Appendix C along with Table 5.2.1 illustrates that constraints that were excluded frequently tended to exhibit high differences or discrepancies. Looking at the constraints defined only at the SADA level, there was a positive relationship between the number of times a constraint was excluded and the absolute difference between census counts and long-form estimates. The “Persons in a couple (married or common-law)” (COUPLE) constraint exhibited the largest absolute difference of 8,642 while being the fourth most excluded constraint having been excluded 627 times between the coverage and non‑response adjustment and final calibration. Lastly, among the SADA-only constraints with the top 10 largest relative differences, 7 constraints were also a part of the top 10 most excluded.
Across all possible constraints, the top 10 largest absolute differences were between 2,466 and 8,642. However, because the census counts were so high, the discrepancies for these constraints were small (ranging from -0.45% to 0.28%). The largest discrepancies were observed for some of the place of birth categories. Many place of birth categories are uncommon in Canada and are therefore frequently excluded during calibration. This resulted in some large absolute differences and particularly large absolute discrepancies.
| Characteristic | Census counts | Design weights | Coverage and non-response adjusted weights | Final weights | ||||
|---|---|---|---|---|---|---|---|---|
| estimates | difference | estimates | difference | estimates | difference | discrepancy (%) | ||
| ADULTCF | 18,645,248 | 18,561,008 | -84,240 | 18,646,762 | 1,514 | 18,646,559 | 1,311 | 0.01 |
| AGE00_14 | 5,863,246 | 5,825,360 | -37,886 | 5,862,200 | -1,046 | 5,863,461 | 215 | 0.00 |
| AGE14 | 2,074,620 | 2,061,284 | -13,336 | 2,075,061 | 441 | 2,074,101 | -519 | -0.03 |
| AGE15_24 | 4,110,940 | 4,060,056 | -50,884 | 4,109,533 | -1,407 | 4,111,450 | 510 | 0.01 |
| AGE15_29 | 6,479,017 | 6,395,416 | -83,601 | 6,475,962 | -3,055 | 6,479,062 | 45 | 0.00 |
| AGE19 | 1,960,356 | 1,942,036 | -18,320 | 1,965,980 | 5,624 | 1,965,564 | 5,208 | 0.27 |
| AGE24 | 2,150,584 | 2,118,020 | -32,564 | 2,143,553 | -7,031 | 2,145,886 | -4,698 | -0.22 |
| AGE25_34 | 4,835,713 | 4,774,696 | -61,017 | 4,833,889 | -1,824 | 4,835,382 | -331 | -0.01 |
| AGE29 | 2,368,077 | 2,335,360 | -32,717 | 2,366,429 | -1,648 | 2,367,612 | -465 | -0.02 |
| AGE30_49 | 9,549,900 | 9,477,840 | -72,060 | 9,547,899 | -2,001 | 9,550,076 | 176 | 0.00 |
| AGE34 | 2,467,636 | 2,439,336 | -28,300 | 2,467,460 | -176 | 2,467,770 | 134 | 0.01 |
| AGE35_44 | 4,820,439 | 4,784,580 | -35,859 | 4,819,469 | -970 | 4,820,173 | -266 | -0.01 |
| AGE39 | 2,464,600 | 2,441,428 | -23,172 | 2,464,015 | -585 | 2,464,706 | 106 | 0.00 |
| AGE4 | 1,783,383 | 1,769,160 | -14,223 | 1,782,623 | -760 | 1,783,298 | -85 | 0.00 |
| AGE44 | 2,355,839 | 2,343,152 | -12,687 | 2,355,454 | -385 | 2,355,468 | -371 | -0.02 |
| AGE45_54 | 4,582,978 | 4,553,408 | -29,570 | 4,581,504 | -1,474 | 4,582,969 | -9 | 0.00 |
| AGE49 | 2,261,825 | 2,253,924 | -7,901 | 2,260,970 | -855 | 2,262,132 | 307 | 0.01 |
| AGE50_64 | 7,432,010 | 7,390,072 | -41,938 | 7,431,294 | -716 | 7,431,838 | -172 | 0.00 |
| AGE54 | 2,321,153 | 2,299,484 | -21,669 | 2,320,534 | -619 | 2,320,837 | -316 | -0.01 |
| AGE55_64 | 5,110,857 | 5,090,588 | -20,269 | 5,110,759 | -98 | 5,111,001 | 144 | 0.00 |
| AGE59 | 2,593,703 | 2,581,512 | -12,191 | 2,593,232 | -471 | 2,593,861 | 158 | 0.01 |
| AGE64 | 2,517,154 | 2,509,076 | -8,078 | 2,517,527 | 373 | 2,517,141 | -13 | 0.00 |
| AGE65PL | 6,534,621 | 6,522,260 | -12,361 | 6,535,110 | 489 | 6,534,356 | -265 | 0.00 |
| AGE74 | 3,958,758 | 3,953,664 | -5,094 | 3,959,122 | 364 | 3,957,893 | -865 | -0.02 |
| AGE75PL | 2,575,863 | 2,568,596 | -7,267 | 2,575,987 | 124 | 2,576,463 | 600 | 0.02 |
| AGE9 | 2,005,243 | 1,994,916 | -10,327 | 2,004,516 | -727 | 2,006,063 | 820 | 0.04 |
| APT5PLUS | 1,593,869 | 1,585,684 | -8,185 | 1,593,702 | -167 | 1,593,648 | -221 | -0.01 |
| APTLT5 | 2,728,558 | 2,713,976 | -14,582 | 2,727,869 | -689 | 2,728,625 | 67 | 0.00 |
| CHILD | 10,442,414 | 10,361,584 | -80,830 | 10,442,904 | 490 | 10,443,251 | 837 | 0.01 |
| CHILDFAM | 5,884,937 | 5,846,660 | -38,277 | 5,883,853 | -1,084 | 5,884,257 | -680 | -0.01 |
| COMLAWNO_DIV | 1,859,786 | 1,849,532 | -10,254 | 1,859,958 | 172 | 1,859,981 | 195 | 0.01 |
| COMLAWNO_OTHERS | 4,008,592 | 3,990,936 | -17,656 | 4,008,187 | -405 | 4,008,588 | -4 | 0.00 |
| COMLAWNO_SEP | 716,514 | 711,864 | -4,650 | 716,241 | -273 | 716,757 | 243 | 0.03 |
| COMLAWNO_SINGLE | 14,508,945 | 14,350,816 | -158,129 | 14,504,993 | -3,952 | 14,508,422 | -523 | 0.00 |
| COMLAWNO_SINGLE_GE15 | 8,645,699 | 8,525,456 | -120,243 | 8,642,793 | -2,906 | 8,644,960 | -739 | -0.01 |
| COMLAWNO_SINGLE_LT15 | 5,863,246 | 5,825,360 | -37,886 | 5,862,200 | -1,046 | 5,863,461 | 215 | 0.00 |
| COMLAWNO_WID | 1,432,292 | 1,429,540 | -2,752 | 1,431,989 | -303 | 1,431,849 | -443 | -0.03 |
| COMLAWYE_MARRIED | 17,341,257 | 17,269,196 | -72,061 | 17,339,283 | -1,974 | 17,341,785 | 528 | 0.00 |
| COMLAW_YE | 3,836,830 | 3,812,728 | -24,102 | 3,835,614 | -1,216 | 3,835,160 | -1,670 | -0.04 |
| COUPLE | 17,005,592 | 16,940,552 | -65,040 | 17,009,739 | 4,147 | 17,014,234 | 8,642 | 0.05 |
| EMPIN_GT50 | 10,466,983 | 10,418,360 | -48,623 | 10,468,477 | 1,494 | 10,466,948 | -35 | 0.00 |
| EMPIN_LE50 | 10,470,465 | 10,370,160 | -100,305 | 10,466,820 | -3,645 | 10,470,574 | 109 | 0.00 |
| EMPIN_P0 | 14,921,346 | 14,822,428 | -98,918 | 14,917,167 | -4,179 | 14,921,272 | -74 | 0.00 |
| EMPIN_P0_GE15 | 9,058,100 | 8,997,068 | -61,032 | 9,054,967 | -3,133 | 9,057,810 | -290 | 0.00 |
| EMPIN_P0_LT15 | 5,863,246 | 5,825,360 | -37,886 | 5,862,200 | -1,046 | 5,863,461 | 215 | 0.00 |
| EMPIN_P100 | 5,232,212 | 5,212,280 | -19,932 | 5,231,362 | -850 | 5,231,417 | -795 | -0.02 |
| EMPIN_P25 | 5,237,240 | 5,184,568 | -52,672 | 5,233,499 | -3,741 | 5,238,205 | 965 | 0.02 |
| EMPIN_P50 | 5,233,225 | 5,185,592 | -47,633 | 5,233,321 | 96 | 5,232,369 | -856 | -0.02 |
| EMPIN_P75 | 5,234,771 | 5,206,080 | -28,691 | 5,237,115 | 2,344 | 5,235,531 | 760 | 0.01 |
| EMPIN_SADA_GT50 | 10,468,377 | 10,421,676 | -46,701 | 10,468,529 | 152 | 10,468,160 | -217 | 0.00 |
| EMPIN_SADA_LE50 | 10,469,071 | 10,366,844 | -102,227 | 10,466,767 | -2,304 | 10,469,363 | 292 | 0.00 |
| EMPIN_SADA_P0 | 14,921,346 | 14,822,428 | -98,918 | 14,917,167 | -4,179 | 14,921,272 | -74 | 0.00 |
| EMPIN_SADA_P0_GE15 | 9,058,100 | 8,997,068 | -61,032 | 9,054,967 | -3,133 | 9,057,810 | -290 | 0.00 |
| EMPIN_SADA_P0_LT15 | 5,863,246 | 5,825,360 | -37,886 | 5,862,200 | -1,046 | 5,863,461 | 215 | 0.00 |
| EMPIN_SADA_P100 | 5,234,004 | 5,216,312 | -17,692 | 5,234,300 | 296 | 5,234,269 | 265 | 0.01 |
| EMPIN_SADA_P25 | 5,235,162 | 5,181,240 | -53,922 | 5,231,079 | -4,083 | 5,235,190 | 28 | 0.00 |
| EMPIN_SADA_P50 | 5,233,909 | 5,185,604 | -48,305 | 5,235,688 | 1,779 | 5,234,173 | 264 | 0.01 |
| EMPIN_SADA_P75 | 5,234,373 | 5,205,364 | -29,009 | 5,234,229 | -144 | 5,233,890 | -483 | -0.01 |
| FEMALE | 18,157,552 | 18,051,988 | -105,564 | 18,155,596 | -1,956 | 18,157,618 | 66 | 0.00 |
| FEMALEGE15 | 15,303,878 | 15,217,160 | -86,718 | 15,302,343 | -1,535 | 15,303,972 | 94 | 0.00 |
| FEMALELT15 | 2,853,674 | 2,834,828 | -18,846 | 2,853,253 | -421 | 2,853,646 | -28 | 0.00 |
| HHADA | 14,826,894 | 14,768,580 | -58,314 | 14,826,894 | 0 | 14,826,894 | 0 | 0.00 |
| HHADACSD | 14,826,894 | 14,768,580 | -58,314 | 14,826,894 | 0 | 14,826,894 | 0 | 0.00 |
| HHINC_GT50 | 7,412,136 | 7,372,056 | -40,080 | 7,414,714 | 2,578 | 7,412,314 | 178 | 0.00 |
| HHINC_LE50 | 7,414,758 | 7,396,524 | -18,234 | 7,412,180 | -2,578 | 7,414,580 | -178 | 0.00 |
| HHINC_P100 | 3,704,978 | 3,678,564 | -26,414 | 3,703,026 | -1,952 | 3,704,942 | -36 | 0.00 |
| HHINC_P25 | 3,708,673 | 3,704,396 | -4,277 | 3,708,008 | -665 | 3,708,664 | -9 | 0.00 |
| HHINC_P50 | 3,706,085 | 3,692,128 | -13,957 | 3,704,172 | -1,913 | 3,705,915 | -170 | 0.00 |
| HHINC_P75 | 3,707,158 | 3,693,492 | -13,666 | 3,711,687 | 4,529 | 3,707,372 | 214 | 0.01 |
| HHINC_SADA_GT50 | 7,413,255 | 7,373,352 | -39,903 | 7,413,008 | -247 | 7,413,093 | -162 | 0.00 |
| HHINC_SADA_LE50 | 7,413,639 | 7,395,228 | -18,411 | 7,413,886 | 247 | 7,413,801 | 162 | 0.00 |
| HHINC_SADA_P100 | 3,706,522 | 3,682,152 | -24,370 | 3,706,067 | -455 | 3,706,454 | -68 | 0.00 |
| HHINC_SADA_P25 | 3,706,961 | 3,702,248 | -4,713 | 3,707,028 | 67 | 3,706,238 | -723 | -0.02 |
| HHINC_SADA_P50 | 3,706,678 | 3,692,980 | -13,698 | 3,706,857 | 179 | 3,707,564 | 886 | 0.02 |
| HHINC_SADA_P75 | 3,706,733 | 3,691,200 | -15,533 | 3,706,941 | 208 | 3,706,638 | -95 | 0.00 |
| HHSIZE1 | 4,356,317 | 4,363,644 | 7,327 | 4,356,599 | 282 | 4,354,798 | -1,519 | -0.03 |
| HHSIZE2 | 5,086,584 | 5,065,324 | -21,260 | 5,087,377 | 793 | 5,086,686 | 102 | 0.00 |
| HHSIZE3 | 2,172,884 | 2,160,960 | -11,924 | 2,172,802 | -82 | 2,172,690 | -194 | -0.01 |
| HHSIZE4 | 1,983,642 | 1,970,564 | -13,078 | 1,984,050 | 408 | 1,984,337 | 695 | 0.04 |
| HHSIZE5 | 777,142 | 770,908 | -6,234 | 779,026 | 1,884 | 779,459 | 2,317 | 0.30 |
| HHSIZEGE5 | 1,227,467 | 1,208,088 | -19,379 | 1,226,066 | -1,401 | 1,228,382 | 915 | 0.07 |
| HHSIZEGE6 | 450,325 | 437,180 | -13,145 | 447,040 | -3,285 | 448,924 | -1,401 | -0.31 |
| INEFAM | 29,985,843 | 29,806,124 | -179,719 | 29,989,178 | 3,335 | 29,991,606 | 5,763 | 0.02 |
| IR_LINK_NO | 35,456,960 | 35,217,972 | -238,988 | 35,451,968 | -4,992 | 35,457,267 | 307 | 0.00 |
| IR_LINK_YE | 401,834 | 392,976 | -8,858 | 400,496 | -1,338 | 401,527 | -307 | -0.08 |
| LIM_NO | 31,967,342 | 31,741,028 | -226,314 | 31,962,884 | -4,458 | 31,966,263 | -1,079 | 0.00 |
| LIM_YE | 3,891,452 | 3,869,920 | -21,532 | 3,889,579 | -1,873 | 3,892,531 | 1,079 | 0.03 |
| LONEPAR | 1,639,656 | 1,620,456 | -19,200 | 1,637,023 | -2,633 | 1,632,325 | -7,331 | -0.45 |
| MALE | 17,701,242 | 17,558,960 | -142,282 | 17,696,868 | -4,374 | 17,701,176 | -66 | 0.00 |
| MALEGE15 | 14,691,670 | 14,568,428 | -123,242 | 14,687,920 | -3,750 | 14,691,361 | -309 | 0.00 |
| MALELT15 | 3,009,572 | 2,990,532 | -19,040 | 3,008,948 | -624 | 3,009,815 | 243 | 0.01 |
| MARRIED | 13,504,427 | 13,456,468 | -47,959 | 13,503,668 | -759 | 13,506,625 | 2,198 | 0.02 |
| NB_NOTINCF | 6,771,132 | 6,688,356 | -82,776 | 6,762,799 | -8,333 | 6,768,984 | -2,148 | -0.03 |
| NOCLDFAM | 4,257,515 | 4,244,072 | -13,443 | 4,258,039 | 524 | 4,255,185 | -2,330 | -0.05 |
| NOINEFAM | 5,872,951 | 5,804,824 | -68,127 | 5,863,285 | -9,666 | 5,867,188 | -5,763 | -0.10 |
| NOINEFAMHHSIZEEQ1 | 4,356,317 | 4,363,644 | 7,327 | 4,356,599 | 282 | 4,354,798 | -1,519 | -0.03 |
| NOINEFAMHHSIZEGT1 | 1,516,634 | 1,441,180 | -75,454 | 1,506,687 | -9,947 | 1,512,390 | -4,244 | -0.28 |
| NOTINFAM | 6,771,132 | 6,688,356 | -82,776 | 6,762,799 | -8,333 | 6,768,984 | -2,148 | -0.03 |
| NOTINFAMHHSIZEEQ1 | 4,356,317 | 4,363,644 | 7,327 | 4,356,599 | 282 | 4,354,798 | -1,519 | -0.03 |
| NOTINFAMHHSIZEGT1 | 2,414,815 | 2,324,712 | -90,103 | 2,406,200 | -8,615 | 2,414,186 | -629 | -0.03 |
| OLN_BI | 6,523,298 | 6,482,368 | -40,930 | 6,523,158 | -140 | 6,524,917 | 1,619 | 0.02 |
| OLN_EN | 24,660,168 | 24,472,152 | -188,016 | 24,656,197 | -3,971 | 24,658,926 | -1,242 | -0.01 |
| OLN_FR | 3,996,708 | 3,982,912 | -13,796 | 3,996,280 | -428 | 3,996,783 | 75 | 0.00 |
| OLN_NO | 678,620 | 673,516 | -5,104 | 676,829 | -1,791 | 678,168 | -452 | -0.07 |
| OTHERDTYPE | 2,742,490 | 2,728,540 | -13,950 | 2,742,407 | -83 | 2,742,753 | 263 | 0.01 |
| POBG2_1 | 18,188 | 18,436 | 248 | 18,747 | 559 | 18,398 | 210 | 1.15 |
| POBG2_10 | 69,328 | 68,104 | -1,224 | 68,893 | -435 | 69,005 | -323 | -0.47 |
| POBG2_11 | 100,824 | 100,972 | 148 | 100,654 | -170 | 100,771 | -53 | -0.05 |
| POBG2_16 | 39,401 | 39,044 | -357 | 39,043 | -358 | 39,386 | -15 | -0.04 |
| POBG2_17 | 37,600 | 36,964 | -636 | 36,661 | -939 | 37,076 | -524 | -1.39 |
| POBG2_18 | 4,705 | 4,568 | -137 | 4,571 | -134 | 4,660 | -45 | -0.96 |
| POBG2_19 | 26,175 | 25,972 | -203 | 26,157 | -18 | 26,087 | -88 | -0.34 |
| POBG2_20 | 27,622 | 27,504 | -118 | 27,542 | -80 | 27,646 | 24 | 0.09 |
| POBG2_21 | 973,117 | 971,244 | -1,873 | 974,259 | 1,142 | 973,913 | 796 | 0.08 |
| POBG2_22 | 138,803 | 138,148 | -655 | 140,247 | 1,444 | 140,100 | 1,297 | 0.93 |
| POBG2_24 | 45,496 | 44,620 | -876 | 44,556 | -940 | 44,886 | -610 | -1.34 |
| POBG2_25 | 24,018 | 23,724 | -294 | 23,849 | -169 | 23,699 | -319 | -1.33 |
| POBG2_26 | 90,748 | 90,332 | -416 | 91,084 | 336 | 91,009 | 261 | 0.29 |
| POBG2_27 | 70,378 | 69,804 | -574 | 70,429 | 51 | 70,554 | 176 | 0.25 |
| POBG2_28 | 159,482 | 157,392 | -2,090 | 158,758 | -724 | 159,151 | -331 | -0.21 |
| POBG2_29 | 87,715 | 88,556 | 841 | 88,327 | 612 | 88,550 | 835 | 0.95 |
| POBG2_3 | 39,318 | 39,292 | -26 | 39,516 | 198 | 39,455 | 137 | 0.35 |
| POBG2_30 | 43,855 | 43,428 | -427 | 44,366 | 511 | 44,233 | 378 | 0.86 |
| POBG2_31 | 145,516 | 145,352 | -164 | 146,258 | 742 | 145,899 | 383 | 0.26 |
| POBG2_32 | 208,157 | 207,616 | -541 | 208,788 | 631 | 208,633 | 476 | 0.23 |
| POBG2_33 | 133,732 | 133,192 | -540 | 133,176 | -556 | 133,053 | -679 | -0.51 |
| POBG2_34 | 24,611 | 24,160 | -451 | 24,537 | -74 | 24,468 | -143 | -0.58 |
| POBG2_35 | 75,006 | 74,360 | -646 | 75,190 | 184 | 75,623 | 617 | 0.82 |
| POBG2_36 | 82,061 | 80,744 | -1,317 | 81,632 | -429 | 82,056 | -5 | -0.01 |
| POBG2_37 | 135,441 | 133,692 | -1,749 | 134,832 | -609 | 135,038 | -403 | -0.30 |
| POBG2_38 | 97,604 | 97,816 | 212 | 98,419 | 815 | 98,205 | 601 | 0.62 |
| POBG2_39 | 33,558 | 33,732 | 174 | 33,517 | -41 | 33,587 | 29 | 0.09 |
| POBG2_4 | 69,501 | 69,680 | 179 | 69,323 | -178 | 69,454 | -47 | -0.07 |
| POBG2_40 | 147,988 | 148,988 | 1,000 | 147,968 | -20 | 147,920 | -68 | -0.05 |
| POBG2_41 | 2,707 | 2,676 | -31 | 2,736 | 29 | 2,713 | 6 | 0.21 |
| POBG2_42 | 207,251 | 203,500 | -3,751 | 206,111 | -1,140 | 207,270 | 19 | 0.01 |
| POBG2_43 | 759,124 | 760,536 | 1,412 | 761,959 | 2,835 | 761,199 | 2,075 | 0.27 |
| POBG2_45 | 93,239 | 92,184 | -1,055 | 93,552 | 313 | 93,699 | 460 | 0.49 |
| POBG2_46 | 73,961 | 73,020 | -941 | 73,263 | -698 | 73,343 | -618 | -0.84 |
| POBG2_47 | 182,036 | 179,428 | -2,608 | 180,255 | -1,781 | 180,423 | -1,613 | -0.89 |
| POBG2_48 | 453,197 | 451,084 | -2,113 | 454,014 | 817 | 453,697 | 500 | 0.11 |
| POBG2_50 | 1,117 | 1,104 | -13 | 1,121 | 4 | 1,091 | -26 | -2.29 |
| POBG2_51 | 20,746 | 20,264 | -482 | 20,457 | -289 | 20,452 | -294 | -1.42 |
| POBG2_54 | 114,417 | 114,916 | 499 | 114,900 | 483 | 114,799 | 382 | 0.33 |
| POBG2_55 | 21,665 | 21,680 | 15 | 22,065 | 400 | 21,929 | 264 | 1.22 |
| POBG2_56 | 87,057 | 86,636 | -421 | 87,125 | 68 | 87,376 | 319 | 0.37 |
| POBG2_57 | 31,161 | 30,388 | -773 | 30,862 | -299 | 30,901 | -260 | -0.84 |
| POBG2_59 | 50,363 | 51,048 | 685 | 51,538 | 1,175 | 51,260 | 897 | 1.78 |
| POBG2_6 | 38,714 | 38,148 | -566 | 38,503 | -211 | 38,242 | -472 | -1.22 |
| POBG2_60 | 129,348 | 128,936 | -412 | 129,813 | 465 | 129,745 | 397 | 0.31 |
| POBG2_63 | 12,109 | 12,044 | -65 | 11,964 | -145 | 12,044 | -65 | -0.54 |
| POBG2_64 | 1,282,470 | 1,274,528 | -7,942 | 1,284,077 | 1,607 | 1,281,244 | -1,226 | -0.10 |
| POBG2_65 | 33,796 | 33,840 | 44 | 33,947 | 151 | 33,820 | 24 | 0.07 |
| POBG2_66 | 340,472 | 340,244 | -228 | 340,373 | -99 | 340,034 | -438 | -0.13 |
| POBG2_67 | 225,939 | 224,856 | -1,083 | 225,835 | -104 | 226,274 | 335 | 0.15 |
| POBG2_68 | 30,781 | 29,976 | -805 | 30,454 | -327 | 30,502 | -279 | -0.91 |
| POBG2_69 | 132,839 | 131,732 | -1,107 | 133,079 | 240 | 132,934 | 95 | 0.07 |
| POBG2_7 | 77,130 | 76,736 | -394 | 76,908 | -222 | 76,934 | -196 | -0.25 |
| POBG2_70 | 62,339 | 61,204 | -1,135 | 61,677 | -662 | 61,229 | -1,110 | -1.78 |
| POBG2_71 | 108,119 | 107,468 | -651 | 108,495 | 376 | 108,324 | 205 | 0.19 |
| POBG2_9 | 1,800 | 1,896 | 96 | 1,906 | 106 | 1,942 | 142 | 7.91 |
| POBG3_10 | 356,921 | 356,844 | -77 | 356,937 | 16 | 356,600 | -321 | -0.09 |
| POBG3_12 | 60,983 | 60,972 | -11 | 61,581 | 598 | 61,384 | 401 | 0.66 |
| POBG3_14 | 372,701 | 368,480 | -4,221 | 373,187 | 486 | 373,777 | 1,076 | 0.29 |
| POBG3_15 | 991,957 | 992,892 | 935 | 995,727 | 3,770 | 994,720 | 2,763 | 0.28 |
| POBG3_16 | 52,163 | 52,944 | 781 | 53,444 | 1,281 | 53,202 | 1,039 | 1.99 |
| POBG3_17 | 1,436,629 | 1,427,828 | -8,801 | 1,438,445 | 1,816 | 1,435,473 | -1,156 | -0.08 |
| POBG3_18 | 333,700 | 330,792 | -2,908 | 333,977 | 277 | 334,217 | 517 | 0.15 |
| POBG3_19 | 238,714 | 236,492 | -2,222 | 238,111 | -603 | 238,401 | -313 | -0.13 |
| POBG3_2 | 371,246 | 369,500 | -1,746 | 371,278 | 32 | 371,108 | -138 | -0.04 |
| POBG3_20 | 225,939 | 224,856 | -1,083 | 225,835 | -104 | 226,274 | 335 | 0.15 |
| POBG3_21 | 197,885 | 195,612 | -2,273 | 197,493 | -392 | 196,876 | -1,009 | -0.51 |
| POBG3_22 | 269,123 | 268,664 | -459 | 269,484 | 361 | 268,968 | -155 | -0.06 |
| POBG3_3 | 81,706 | 80,576 | -1,130 | 80,276 | -1,430 | 81,123 | -583 | -0.71 |
| POBG3_4 | 188,533 | 187,180 | -1,353 | 188,954 | 421 | 188,989 | 456 | 0.24 |
| POBG3_5 | 230,116 | 228,392 | -1,724 | 230,849 | 733 | 230,586 | 470 | 0.20 |
| POBG3_6 | 1,156,486 | 1,155,964 | -522 | 1,157,691 | 1,205 | 1,157,397 | 911 | 0.08 |
| POBG3_7 | 260,737 | 260,508 | -229 | 260,109 | -628 | 260,456 | -281 | -0.11 |
| POBG3_8 | 709,194 | 703,532 | -5,662 | 707,532 | -1,662 | 707,463 | -1,731 | -0.24 |
| POBG3_9 | 294,966 | 292,056 | -2,910 | 294,438 | -528 | 295,820 | 854 | 0.29 |
| PPADA | 35,858,794 | 35,610,948 | -247,846 | 35,852,464 | -6,330 | 35,858,794 | 0 | 0.00 |
| PPADACSD | 35,858,794 | 35,610,948 | -247,846 | 35,852,464 | -6,330 | 35,858,794 | 0 | 0.00 |
| SNGLDET | 7,761,977 | 7,740,380 | -21,597 | 7,762,916 | 939 | 7,761,868 | -109 | 0.00 |
| TOTCFAM | 10,142,452 | 10,090,732 | -51,720 | 10,141,892 | -560 | 10,139,442 | -3,010 | -0.03 |
| TOTHHLD | 14,826,894 | 14,768,580 | -58,314 | 14,826,894 | 0 | 14,826,894 | 0 | 0.00 |
| TOTPERS | 35,858,794 | 35,610,948 | -247,846 | 35,852,464 | -6,330 | 35,858,794 | 0 | 0.00 |
| TPERGE15 | 29,995,548 | 29,785,588 | -209,960 | 29,990,263 | -5,285 | 29,995,333 | -215 | 0.00 |
| TPERLT15 | 5,863,246 | 5,825,360 | -37,886 | 5,862,200 | -1,046 | 5,863,461 | 215 | 0.00 |
| YRIMD_1900 | 1,057,784 | 1,051,708 | -6,076 | 1,057,998 | 214 | 1,057,899 | 115 | 0.01 |
| YRIMD_1980 | 336,657 | 335,244 | -1,413 | 335,330 | -1,327 | 336,180 | -477 | -0.14 |
| YRIMD_1986 | 478,539 | 477,856 | -683 | 479,476 | 937 | 479,823 | 1,284 | 0.27 |
| YRIMD_1991 | 704,709 | 705,148 | 439 | 706,313 | 1,604 | 705,588 | 879 | 0.12 |
| YRIMD_1996 | 664,518 | 662,160 | -2,358 | 665,920 | 1,402 | 665,189 | 671 | 0.10 |
| YRIMD_2001 | 834,315 | 830,188 | -4,127 | 833,798 | -517 | 833,822 | -493 | -0.06 |
| YRIMD_2006 | 938,128 | 935,132 | -2,996 | 938,038 | -90 | 938,252 | 124 | 0.01 |
| YRIMD_2011 | 1,045,048 | 1,038,256 | -6,792 | 1,045,197 | 149 | 1,044,095 | -953 | -0.09 |
| YRIMD_2016 | 1,265,550 | 1,261,424 | -4,126 | 1,265,880 | 330 | 1,265,578 | 28 | 0.00 |
| YRIMD_M3 | 27,740,538 | 27,530,424 | -210,114 | 27,729,416 | -11,122 | 27,738,072 | -2,466 | -0.01 |
| YRIMD_M5 | 793,008 | 783,408 | -9,600 | 795,099 | 2,091 | 794,295 | 1,287 | 0.16 |
| YRIMG1_1900 | 1,057,784 | 1,051,708 | -6,076 | 1,057,998 | 214 | 1,057,899 | 115 | 0.01 |
| YRIMG1_1980 | 815,196 | 813,100 | -2,096 | 814,806 | -390 | 816,003 | 807 | 0.10 |
| YRIMG1_1991 | 1,369,227 | 1,367,308 | -1,919 | 1,372,232 | 3,005 | 1,370,777 | 1,550 | 0.11 |
| YRIMG1_2001 | 1,772,443 | 1,765,320 | -7,123 | 1,771,836 | -607 | 1,772,075 | -368 | -0.02 |
| YRIMG1_2011 | 1,045,048 | 1,038,256 | -6,792 | 1,045,197 | 149 | 1,044,095 | -953 | -0.09 |
| YRIMG1_2016 | 1,265,550 | 1,261,424 | -4,126 | 1,265,880 | 330 | 1,265,578 | 28 | 0.00 |
| YRIMG1_M3 | 27,740,538 | 27,530,424 | -210,114 | 27,729,416 | -11,122 | 27,738,072 | -2,466 | -0.01 |
| YRIMG1_M5 | 793,008 | 783,408 | -9,600 | 795,099 | 2,091 | 794,295 | 1,287 | 0.16 |
|
Note: All households with a design weight of 1 were excluded from the weighting process. These households either were located in First Nations communities, Métis Settlements, Inuit regions or other remote areas, or were private households attached to a collective dwelling. Source: Statistics Canada, 2021 Census long-form sample. |
||||||||
Data table for Chart 5.2.2
| Constraint | Census count (in thousands) | Design weights | Coverage and non‑response adjusted weights | Final weights |
|---|---|---|---|---|
| difference (in thousands) | ||||
| POBG2_50 | 1 | -0.01 | 0.00 | -0.03 |
| POBG2_9 | 2 | 0.10 | 0.11 | 0.14 |
| POBG2_41 | 3 | -0.03 | 0.03 | 0.01 |
| POBG2_18 | 5 | -0.14 | -0.13 | -0.05 |
| POBG2_63 | 12 | -0.07 | -0.15 | -0.07 |
| POBG2_1 | 18 | 0.25 | 0.56 | 0.21 |
| POBG2_51 | 21 | -0.48 | -0.29 | -0.29 |
| POBG2_55 | 22 | 0.02 | 0.40 | 0.26 |
| POBG2_25 | 24 | -0.29 | -0.17 | -0.32 |
| POBG2_34 | 25 | -0.45 | -0.07 | -0.14 |
| POBG2_19 | 26 | -0.20 | -0.02 | -0.09 |
| POBG2_20 | 28 | -0.12 | -0.08 | 0.02 |
| POBG2_68 | 31 | -0.81 | -0.33 | -0.28 |
| POBG2_57 | 31 | -0.77 | -0.30 | -0.26 |
| POBG2_39 | 34 | 0.17 | -0.04 | 0.03 |
| POBG2_65 | 34 | 0.04 | 0.15 | 0.02 |
| POBG2_17 | 38 | -0.64 | -0.94 | -0.52 |
| POBG2_6 | 39 | -0.57 | -0.21 | -0.47 |
| POBG2_3 | 39 | -0.03 | 0.20 | 0.14 |
| POBG2_16 | 39 | -0.36 | -0.36 | -0.02 |
| POBG2_30 | 44 | -0.43 | 0.51 | 0.38 |
| POBG2_24 | 45 | -0.88 | -0.94 | -0.61 |
| POBG2_59 | 50 | 0.69 | 1.18 | 0.90 |
| POBG3_16 | 52 | 0.78 | 1.28 | 1.04 |
| POBG3_12 | 61 | -0.01 | 0.60 | 0.40 |
| POBG2_70 | 62 | -1.14 | -0.66 | -1.11 |
| POBG2_10 | 69 | -1.22 | -0.44 | -0.32 |
| POBG2_4 | 70 | 0.18 | -0.18 | -0.05 |
| POBG2_27 | 70 | -0.57 | 0.05 | 0.18 |
| POBG2_46 | 74 | -0.94 | -0.70 | -0.62 |
| POBG2_35 | 75 | -0.65 | 0.18 | 0.62 |
| POBG2_7 | 77 | -0.39 | -0.22 | -0.20 |
| POBG3_3 | 82 | -1.13 | -1.43 | -0.58 |
| POBG2_36 | 82 | -1.32 | -0.43 | -0.01 |
| POBG2_56 | 87 | -0.42 | 0.07 | 0.32 |
| POBG2_29 | 88 | 0.84 | 0.61 | 0.84 |
| POBG2_26 | 91 | -0.42 | 0.34 | 0.26 |
| POBG2_45 | 93 | -1.06 | 0.31 | 0.46 |
| POBG2_38 | 98 | 0.21 | 0.82 | 0.60 |
| POBG2_11 | 101 | 0.15 | -0.17 | -0.05 |
| POBG2_71 | 108 | -0.65 | 0.38 | 0.21 |
| POBG2_54 | 114 | 0.50 | 0.48 | 0.38 |
| POBG2_60 | 129 | -0.41 | 0.47 | 0.40 |
| POBG2_69 | 133 | -1.11 | 0.24 | 0.10 |
| POBG2_33 | 134 | -0.54 | -0.56 | -0.68 |
| POBG2_37 | 135 | -1.75 | -0.61 | -0.40 |
| POBG2_22 | 139 | -0.66 | 1.44 | 1.30 |
| POBG2_31 | 146 | -0.16 | 0.74 | 0.38 |
| POBG2_40 | 148 | 1.00 | -0.02 | -0.07 |
| POBG2_28 | 159 | -2.09 | -0.72 | -0.33 |
| POBG2_47 | 182 | -2.61 | -1.78 | -1.61 |
| POBG3_4 | 189 | -1.35 | 0.42 | 0.46 |
| POBG3_21 | 198 | -2.27 | -0.39 | -1.01 |
| POBG2_42 | 207 | -3.75 | -1.14 | 0.02 |
| POBG2_32 | 208 | -0.54 | 0.63 | 0.48 |
| POBG2_67 | 226 | -1.08 | -0.10 | 0.34 |
| POBG3_20 | 226 | -1.08 | -0.10 | 0.34 |
| POBG3_5 | 230 | -1.72 | 0.73 | 0.47 |
| POBG3_19 | 239 | -2.22 | -0.60 | -0.31 |
| POBG3_7 | 261 | -0.23 | -0.63 | -0.28 |
| POBG3_22 | 269 | -0.46 | 0.36 | -0.16 |
| POBG3_9 | 295 | -2.91 | -0.53 | 0.85 |
| POBG3_18 | 334 | -2.91 | 0.28 | 0.52 |
| YRIMD_1980 | 337 | -1.41 | -1.33 | -0.48 |
| POBG2_66 | 340 | -0.23 | -0.10 | -0.44 |
| POBG3_10 | 357 | -0.08 | 0.02 | -0.32 |
| POBG3_2 | 371 | -1.75 | 0.03 | -0.14 |
| POBG3_14 | 373 | -4.22 | 0.49 | 1.08 |
| IR_LINK_YE | 402 | -8.86 | -1.34 | -0.31 |
| HHSIZEGE6 | 450 | -13.15 | -3.29 | -1.40 |
| POBG2_48 | 453 | -2.11 | 0.82 | 0.50 |
| YRIMD_1986 | 479 | -0.68 | 0.94 | 1.28 |
| YRIMD_1996 | 665 | -2.36 | 1.40 | 0.67 |
| OLN_NO | 679 | -5.10 | -1.79 | -0.45 |
| YRIMD_1991 | 705 | 0.44 | 1.60 | 0.88 |
| POBG3_8 | 709 | -5.66 | -1.66 | -1.73 |
| COMLAWNO_SEP | 717 | -4.65 | -0.27 | 0.24 |
| POBG2_43 | 759 | 1.41 | 2.84 | 2.08 |
| HHSIZE5 | 777 | -6.23 | 1.88 | 2.32 |
| YRIMD_M5 | 793 | -9.60 | 2.09 | 1.29 |
| YRIMG1_M5 | 793 | -9.60 | 2.09 | 1.29 |
| YRIMG1_1980 | 815 | -2.10 | -0.39 | 0.81 |
| YRIMD_2001 | 834 | -4.13 | -0.52 | -0.49 |
| YRIMD_2006 | 938 | -3.00 | -0.09 | 0.12 |
| POBG2_21 | 973 | -1.87 | 1.14 | 0.80 |
| POBG3_15 | 992 | 0.94 | 3.77 | 2.76 |
| YRIMD_2011 | 1,045 | -6.79 | 0.15 | -0.95 |
| YRIMG1_2011 | 1,045 | -6.79 | 0.15 | -0.95 |
| YRIMD_1900 | 1,058 | -6.08 | 0.21 | 0.12 |
| YRIMG1_1900 | 1,058 | -6.08 | 0.21 | 0.12 |
| POBG3_6 | 1,156 | -0.52 | 1.21 | 0.91 |
| HHSIZEGE5 | 1,227 | -19.38 | -1.40 | 0.92 |
| YRIMD_2016 | 1,266 | -4.13 | 0.33 | 0.03 |
| YRIMG1_2016 | 1,266 | -4.13 | 0.33 | 0.03 |
| POBG2_64 | 1,282 | -7.94 | 1.61 | -1.23 |
| YRIMG1_1991 | 1,369 | -1.92 | 3.01 | 1.55 |
| COMLAWNO_WID | 1,432 | -2.75 | -0.30 | -0.44 |
| POBG3_17 | 1,437 | -8.80 | 1.82 | -1.16 |
| NOINEFAMHHSIZEGT1 | 1,517 | -75.45 | -9.95 | -4.24 |
| APT5PLUS | 1,594 | -8.19 | -0.17 | -0.22 |
| LONEPAR | 1,640 | -19.20 | -2.63 | -7.33 |
| YRIMG1_2001 | 1,772 | -7.12 | -0.61 | -0.37 |
| AGE4 | 1,783 | -14.22 | -0.76 | -0.09 |
| COMLAWNO_DIV | 1,860 | -10.25 | 0.17 | 0.20 |
| AGE19 | 1,960 | -18.32 | 5.62 | 5.21 |
| HHSIZE4 | 1,984 | -13.08 | 0.41 | 0.70 |
| AGE9 | 2,005 | -10.33 | -0.73 | 0.82 |
| AGE14 | 2,075 | -13.34 | 0.44 | -0.52 |
| AGE24 | 2,151 | -32.56 | -7.03 | -4.70 |
| HHSIZE3 | 2,173 | -11.92 | -0.08 | -0.19 |
| AGE49 | 2,262 | -7.90 | -0.86 | 0.31 |
| AGE54 | 2,321 | -21.67 | -0.62 | -0.32 |
| AGE44 | 2,356 | -12.69 | -0.39 | -0.37 |
| AGE29 | 2,368 | -32.72 | -1.65 | -0.47 |
| NOTINFAMHHSIZEGT1 | 2,415 | -90.10 | -8.62 | -0.63 |
| AGE39 | 2,465 | -23.17 | -0.59 | 0.11 |
| AGE34 | 2,468 | -28.30 | -0.18 | 0.13 |
| AGE64 | 2,517 | -8.08 | 0.37 | -0.01 |
| AGE75PL | 2,576 | -7.27 | 0.12 | 0.60 |
| AGE59 | 2,594 | -12.19 | -0.47 | 0.16 |
| APTLT5 | 2,729 | -14.58 | -0.69 | 0.07 |
| OTHERDTYPE | 2,742 | -13.95 | -0.08 | 0.26 |
| FEMALELT15 | 2,854 | -18.85 | -0.42 | -0.03 |
| MALELT15 | 3,010 | -19.04 | -0.62 | 0.24 |
| HHINC_P100 | 3,705 | -26.41 | -1.95 | -0.04 |
| HHINC_P50 | 3,706 | -13.96 | -1.91 | -0.17 |
| HHINC_SADA_P100 | 3,707 | -24.37 | -0.46 | -0.07 |
| HHINC_SADA_P50 | 3,707 | -13.70 | 0.18 | 0.89 |
| HHINC_SADA_P75 | 3,707 | -15.53 | 0.21 | -0.10 |
| HHINC_SADA_P25 | 3,707 | -4.71 | 0.07 | -0.72 |
| HHINC_P75 | 3,707 | -13.67 | 4.53 | 0.21 |
| HHINC_P25 | 3,709 | -4.28 | -0.67 | -0.01 |
| COMLAW_YE | 3,837 | -24.10 | -1.22 | -1.67 |
| LIM_YE | 3,891 | -21.53 | -1.87 | 1.08 |
| AGE74 | 3,959 | -5.09 | 0.36 | -0.87 |
| OLN_FR | 3,997 | -13.80 | -0.43 | 0.08 |
| COMLAWNO_OTHERS | 4,009 | -17.66 | -0.41 | 0.00 |
| AGE15_24 | 4,111 | -50.88 | -1.41 | 0.51 |
| NOCLDFAM | 4,258 | -13.44 | 0.52 | -2.33 |
| HHSIZE1 | 4,356 | 7.33 | 0.28 | -1.52 |
| NOINEFAMHHSIZEEQ1 | 4,356 | 7.33 | 0.28 | -1.52 |
| NOTINFAMHHSIZEEQ1 | 4,356 | 7.33 | 0.28 | -1.52 |
| AGE45_54 | 4,583 | -29.57 | -1.47 | -0.01 |
| AGE35_44 | 4,820 | -35.86 | -0.97 | -0.27 |
| AGE25_34 | 4,836 | -61.02 | -1.82 | -0.33 |
| HHSIZE2 | 5,087 | -21.26 | 0.79 | 0.10 |
| AGE55_64 | 5,111 | -20.27 | -0.10 | 0.14 |
| EMPIN_P100 | 5,232 | -19.93 | -0.85 | -0.80 |
| EMPIN_P50 | 5,233 | -47.63 | 0.10 | -0.86 |
| EMPIN_SADA_P50 | 5,234 | -48.31 | 1.78 | 0.26 |
| EMPIN_SADA_P100 | 5,234 | -17.69 | 0.30 | 0.27 |
| EMPIN_SADA_P75 | 5,234 | -29.01 | -0.14 | -0.48 |
| EMPIN_P75 | 5,235 | -28.69 | 2.34 | 0.76 |
| EMPIN_SADA_P25 | 5,235 | -53.92 | -4.08 | 0.03 |
| EMPIN_P25 | 5,237 | -52.67 | -3.74 | 0.97 |
| AGE00_14 | 5,863 | -37.89 | -1.05 | 0.22 |
| COMLAWNO_SINGLE_LT15 | 5,863 | -37.89 | -1.05 | 0.22 |
| EMPIN_P0_LT15 | 5,863 | -37.89 | -1.05 | 0.22 |
| EMPIN_SADA_P0_LT15 | 5,863 | -37.89 | -1.05 | 0.22 |
| TPERLT15 | 5,863 | -37.89 | -1.05 | 0.22 |
| NOINEFAM | 5,873 | -68.13 | -9.67 | -5.76 |
| CHILDFAM | 5,885 | -38.28 | -1.08 | -0.68 |
| AGE15_29 | 6,479 | -83.60 | -3.06 | 0.05 |
| OLN_BI | 6,523 | -40.93 | -0.14 | 1.62 |
| AGE65PL | 6,535 | -12.36 | 0.49 | -0.27 |
| NB_NOTINCF | 6,771 | -82.78 | -8.33 | -2.15 |
| NOTINFAM | 6,771 | -82.78 | -8.33 | -2.15 |
| HHINC_GT50 | 7,412 | -40.08 | 2.58 | 0.18 |
| HHINC_SADA_GT50 | 7,413 | -39.90 | -0.25 | -0.16 |
| HHINC_SADA_LE50 | 7,414 | -18.41 | 0.25 | 0.16 |
| HHINC_LE50 | 7,415 | -18.23 | -2.58 | -0.18 |
| AGE50_64 | 7,432 | -41.94 | -0.72 | -0.17 |
| SNGLDET | 7,762 | -21.60 | 0.94 | -0.11 |
| COMLAWNO_SINGLE_GE15 | 8,646 | -120.24 | -2.91 | -0.74 |
| EMPIN_P0_GE15 | 9,058 | -61.03 | -3.13 | -0.29 |
| EMPIN_SADA_P0_GE15 | 9,058 | -61.03 | -3.13 | -0.29 |
| AGE30_49 | 9,550 | -72.06 | -2.00 | 0.18 |
| TOTCFAM | 10,142 | -51.72 | -0.56 | -3.01 |
| CHILD | 10,442 | -80.83 | 0.49 | 0.84 |
| EMPIN_GT50 | 10,467 | -48.62 | 1.49 | -0.04 |
| EMPIN_SADA_GT50 | 10,468 | -46.70 | 0.15 | -0.22 |
| EMPIN_SADA_LE50 | 10,469 | -102.23 | -2.30 | 0.29 |
| EMPIN_LE50 | 10,470 | -100.31 | -3.65 | 0.11 |
| MARRIED | 13,504 | -47.96 | -0.76 | 2.20 |
| COMLAWNO_SINGLE | 14,509 | -158.13 | -3.95 | -0.52 |
| MALEGE15 | 14,692 | -123.24 | -3.75 | -0.31 |
| HHADA | 14,827 | -58.31 | 0.00 | 0.00 |
| HHADACSD | 14,827 | -58.31 | 0.00 | 0.00 |
| TOTHHLD | 14,827 | -58.31 | 0.00 | 0.00 |
| EMPIN_P0 | 14,921 | -98.92 | -4.18 | -0.07 |
| EMPIN_SADA_P0 | 14,921 | -98.92 | -4.18 | -0.07 |
| FEMALEGE15 | 15,304 | -86.72 | -1.54 | 0.09 |
| COUPLE | 17,006 | -65.04 | 4.15 | 8.64 |
| COMLAWYE_MARRIED | 17,341 | -72.06 | -1.97 | 0.53 |
| MALE | 17,701 | -142.28 | -4.37 | -0.07 |
| FEMALE | 18,158 | -105.56 | -1.96 | 0.07 |
| ADULTCF | 18,645 | -84.24 | 1.51 | 1.31 |
| OLN_EN | 24,660 | -188.02 | -3.97 | -1.24 |
| YRIMD_M3 | 27,741 | -210.11 | -11.12 | -2.47 |
| YRIMG1_M3 | 27,741 | -210.11 | -11.12 | -2.47 |
| INEFAM | 29,986 | -179.72 | 3.34 | 5.76 |
| TPERGE15 | 29,996 | -209.96 | -5.29 | -0.22 |
| LIM_NO | 31,967 | -226.31 | -4.46 | -1.08 |
| IR_LINK_NO | 35,457 | -238.99 | -4.99 | 0.31 |
| PPADA | 35,859 | -247.85 | -6.33 | 0.00 |
| PPADACSD | 35,859 | -247.85 | -6.33 | 0.00 |
| TOTPERS | 35,859 | -247.85 | -6.33 | 0.00 |
|
Note: All households with a design weight of 1 were excluded from the weighting process. These households either were located in First Nations communities, Métis Settlements, Inuit regions or other remote areas, or were private households attached to a collective dwelling. Source: Statistics Canada, 2021 Census long-form sample. |
||||
Data table for Chart 5.2.3
| Constraint | Counts (in thousands) | Discrepancy, final weights (%) |
|---|---|---|
| POBG2_50 | 1 | -2.29 |
| POBG2_9 | 2 | 7.91 |
| POBG2_41 | 3 | 0.21 |
| POBG2_18 | 5 | -0.96 |
| POBG2_63 | 12 | -0.54 |
| POBG2_1 | 18 | 1.15 |
| POBG2_51 | 21 | -1.42 |
| POBG2_55 | 22 | 1.22 |
| POBG2_25 | 24 | -1.33 |
| POBG2_34 | 25 | -0.58 |
| POBG2_19 | 26 | -0.34 |
| POBG2_20 | 28 | 0.09 |
| POBG2_68 | 31 | -0.91 |
| POBG2_57 | 31 | -0.84 |
| POBG2_39 | 34 | 0.09 |
| POBG2_65 | 34 | 0.07 |
| POBG2_17 | 38 | -1.39 |
| POBG2_6 | 39 | -1.22 |
| POBG2_3 | 39 | 0.35 |
| POBG2_16 | 39 | -0.04 |
| POBG2_30 | 44 | 0.86 |
| POBG2_24 | 45 | -1.34 |
| POBG2_59 | 50 | 1.78 |
| POBG3_16 | 52 | 1.99 |
| POBG3_12 | 61 | 0.66 |
| POBG2_70 | 62 | -1.78 |
| POBG2_10 | 69 | -0.47 |
| POBG2_4 | 70 | -0.07 |
| POBG2_27 | 70 | 0.25 |
| POBG2_46 | 74 | -0.84 |
| POBG2_35 | 75 | 0.82 |
| POBG2_7 | 77 | -0.25 |
| POBG3_3 | 82 | -0.71 |
| POBG2_36 | 82 | -0.01 |
| POBG2_56 | 87 | 0.37 |
| POBG2_29 | 88 | 0.95 |
| POBG2_26 | 91 | 0.29 |
| POBG2_45 | 93 | 0.49 |
| POBG2_38 | 98 | 0.62 |
| POBG2_11 | 101 | -0.05 |
| POBG2_71 | 108 | 0.19 |
| POBG2_54 | 114 | 0.33 |
| POBG2_60 | 129 | 0.31 |
| POBG2_69 | 133 | 0.07 |
| POBG2_33 | 134 | -0.51 |
| POBG2_37 | 135 | -0.30 |
| POBG2_22 | 139 | 0.93 |
| POBG2_31 | 146 | 0.26 |
| POBG2_40 | 148 | -0.05 |
| POBG2_28 | 159 | -0.21 |
| POBG2_47 | 182 | -0.89 |
| POBG3_4 | 189 | 0.24 |
| POBG3_21 | 198 | -0.51 |
| POBG2_42 | 207 | 0.01 |
| POBG2_32 | 208 | 0.23 |
| POBG2_67 | 226 | 0.15 |
| POBG3_20 | 226 | 0.15 |
| POBG3_5 | 230 | 0.20 |
| POBG3_19 | 239 | -0.13 |
| POBG3_7 | 261 | -0.11 |
| POBG3_22 | 269 | -0.06 |
| POBG3_9 | 295 | 0.29 |
| POBG3_18 | 334 | 0.15 |
| YRIMD_1980 | 337 | -0.14 |
| POBG2_66 | 340 | -0.13 |
| POBG3_10 | 357 | -0.09 |
| POBG3_2 | 371 | -0.04 |
| POBG3_14 | 373 | 0.29 |
| IR_LINK_YE | 402 | -0.08 |
| HHSIZEGE6 | 450 | -0.31 |
| POBG2_48 | 453 | 0.11 |
| YRIMD_1986 | 479 | 0.27 |
| YRIMD_1996 | 665 | 0.10 |
| OLN_NO | 679 | -0.07 |
| YRIMD_1991 | 705 | 0.12 |
| POBG3_8 | 709 | -0.24 |
| COMLAWNO_SEP | 717 | 0.03 |
| POBG2_43 | 759 | 0.27 |
| HHSIZE5 | 777 | 0.30 |
| YRIMD_M5 | 793 | 0.16 |
| YRIMG1_M5 | 793 | 0.16 |
| YRIMG1_1980 | 815 | 0.10 |
| YRIMD_2001 | 834 | -0.06 |
| YRIMD_2006 | 938 | 0.01 |
| POBG2_21 | 973 | 0.08 |
| POBG3_15 | 992 | 0.28 |
| YRIMD_2011 | 1,045 | -0.09 |
| YRIMG1_2011 | 1,045 | -0.09 |
| YRIMD_1900 | 1,058 | 0.01 |
| YRIMG1_1900 | 1,058 | 0.01 |
| POBG3_6 | 1,156 | 0.08 |
| HHSIZEGE5 | 1,227 | 0.07 |
| YRIMD_2016 | 1,266 | 0.00 |
| YRIMG1_2016 | 1,266 | 0.00 |
| POBG2_64 | 1,282 | -0.10 |
| YRIMG1_1991 | 1,369 | 0.11 |
| COMLAWNO_WID | 1,432 | -0.03 |
| POBG3_17 | 1,437 | -0.08 |
| NOINEFAMHHSIZEGT1 | 1,517 | -0.28 |
| APT5PLUS | 1,594 | -0.01 |
| LONEPAR | 1,640 | -0.45 |
| YRIMG1_2001 | 1,772 | -0.02 |
| AGE4 | 1,783 | 0.00 |
| COMLAWNO_DIV | 1,860 | 0.01 |
| AGE19 | 1,960 | 0.27 |
| HHSIZE4 | 1,984 | 0.04 |
| AGE9 | 2,005 | 0.04 |
| AGE14 | 2,075 | -0.03 |
| AGE24 | 2,151 | -0.22 |
| HHSIZE3 | 2,173 | -0.01 |
| AGE49 | 2,262 | 0.01 |
| AGE54 | 2,321 | -0.01 |
| AGE44 | 2,356 | -0.02 |
| AGE29 | 2,368 | -0.02 |
| NOTINFAMHHSIZEGT1 | 2,415 | -0.03 |
| AGE39 | 2,465 | 0.00 |
| AGE34 | 2,468 | 0.01 |
| AGE64 | 2,517 | 0.00 |
| AGE75PL | 2,576 | 0.02 |
| AGE59 | 2,594 | 0.01 |
| APTLT5 | 2,729 | 0.00 |
| OTHERDTYPE | 2,742 | 0.01 |
| FEMALELT15 | 2,854 | 0.00 |
| MALELT15 | 3,010 | 0.01 |
| HHINC_P100 | 3,705 | 0.00 |
| HHINC_P50 | 3,706 | 0.00 |
| HHINC_SADA_P100 | 3,707 | 0.00 |
| HHINC_SADA_P50 | 3,707 | 0.02 |
| HHINC_SADA_P75 | 3,707 | 0.00 |
| HHINC_SADA_P25 | 3,707 | -0.02 |
| HHINC_P75 | 3,707 | 0.01 |
| HHINC_P25 | 3,709 | 0.00 |
| COMLAW_YE | 3,837 | -0.04 |
| LIM_YE | 3,891 | 0.03 |
| AGE74 | 3,959 | -0.02 |
| OLN_FR | 3,997 | 0.00 |
| COMLAWNO_OTHERS | 4,009 | 0.00 |
| AGE15_24 | 4,111 | 0.01 |
| NOCLDFAM | 4,258 | -0.05 |
| HHSIZE1 | 4,356 | -0.03 |
| NOINEFAMHHSIZEEQ1 | 4,356 | -0.03 |
| NOTINFAMHHSIZEEQ1 | 4,356 | -0.03 |
| AGE45_54 | 4,583 | 0.00 |
| AGE35_44 | 4,820 | -0.01 |
| AGE25_34 | 4,836 | -0.01 |
| HHSIZE2 | 5,087 | 0.00 |
| AGE55_64 | 5,111 | 0.00 |
| EMPIN_P100 | 5,232 | -0.02 |
| EMPIN_P50 | 5,233 | -0.02 |
| EMPIN_SADA_P50 | 5,234 | 0.01 |
| EMPIN_SADA_P100 | 5,234 | 0.01 |
| EMPIN_SADA_P75 | 5,234 | -0.01 |
| EMPIN_P75 | 5,235 | 0.01 |
| EMPIN_SADA_P25 | 5,235 | 0.00 |
| EMPIN_P25 | 5,237 | 0.02 |
| AGE00_14 | 5,863 | 0.00 |
| COMLAWNO_SINGLE_LT15 | 5,863 | 0.00 |
| EMPIN_P0_LT15 | 5,863 | 0.00 |
| EMPIN_SADA_P0_LT15 | 5,863 | 0.00 |
| TPERLT15 | 5,863 | 0.00 |
| NOINEFAM | 5,873 | -0.10 |
| CHILDFAM | 5,885 | -0.01 |
| AGE15_29 | 6,479 | 0.00 |
| OLN_BI | 6,523 | 0.02 |
| AGE65PL | 6,535 | 0.00 |
| NB_NOTINCF | 6,771 | -0.03 |
| NOTINFAM | 6,771 | -0.03 |
| HHINC_GT50 | 7,412 | 0.00 |
| HHINC_SADA_GT50 | 7,413 | 0.00 |
| HHINC_SADA_LE50 | 7,414 | 0.00 |
| HHINC_LE50 | 7,415 | 0.00 |
| AGE50_64 | 7,432 | 0.00 |
| SNGLDET | 7,762 | 0.00 |
| COMLAWNO_SINGLE_GE15 | 8,646 | -0.01 |
| EMPIN_P0_GE15 | 9,058 | 0.00 |
| EMPIN_SADA_P0_GE15 | 9,058 | 0.00 |
| AGE30_49 | 9,550 | 0.00 |
| TOTCFAM | 10,142 | -0.03 |
| CHILD | 10,442 | 0.01 |
| EMPIN_GT50 | 10,467 | 0.00 |
| EMPIN_SADA_GT50 | 10,468 | 0.00 |
| EMPIN_SADA_LE50 | 10,469 | 0.00 |
| EMPIN_LE50 | 10,470 | 0.00 |
| MARRIED | 13,504 | 0.02 |
| COMLAWNO_SINGLE | 14,509 | 0.00 |
| MALEGE15 | 14,692 | 0.00 |
| HHADA | 14,827 | 0.00 |
| HHADACSD | 14,827 | 0.00 |
| TOTHHLD | 14,827 | 0.00 |
| EMPIN_P0 | 14,921 | 0.00 |
| EMPIN_SADA_P0 | 14,921 | 0.00 |
| FEMALEGE15 | 15,304 | 0.00 |
| COUPLE | 17,006 | 0.05 |
| COMLAWYE_MARRIED | 17,341 | 0.00 |
| MALE | 17,701 | 0.00 |
| FEMALE | 18,158 | 0.00 |
| ADULTCF | 18,645 | 0.01 |
| OLN_EN | 24,660 | -0.01 |
| YRIMD_M3 | 27,741 | -0.01 |
| YRIMG1_M3 | 27,741 | -0.01 |
| INEFAM | 29,986 | 0.02 |
| TPERGE15 | 29,996 | 0.00 |
| LIM_NO | 31,967 | 0.00 |
| IR_LINK_NO | 35,457 | 0.00 |
| PPADA | 35,859 | 0.00 |
| PPADACSD | 35,859 | 0.00 |
| TOTPERS | 35,859 | 0.00 |
|
Note: All households with a design weight of 1 were excluded from the weighting process. These households either were located in First Nations communities, Métis Settlements, Inuit regions or other remote areas, or were private households attached to a collective dwelling. Source: Statistics Canada, 2021 Census long-form sample. |
||
- Date modified: