
Quick Tutorial for the Census Program Data Viewer
Use the "Map swipe" feature
Compare two mappable indicators for the same geographic level
In this tutorial, we will compare two mappable indicators of interest at the same geographic level. For this tutorial, we will be comparing two income indicators at the census subdivision level.
-
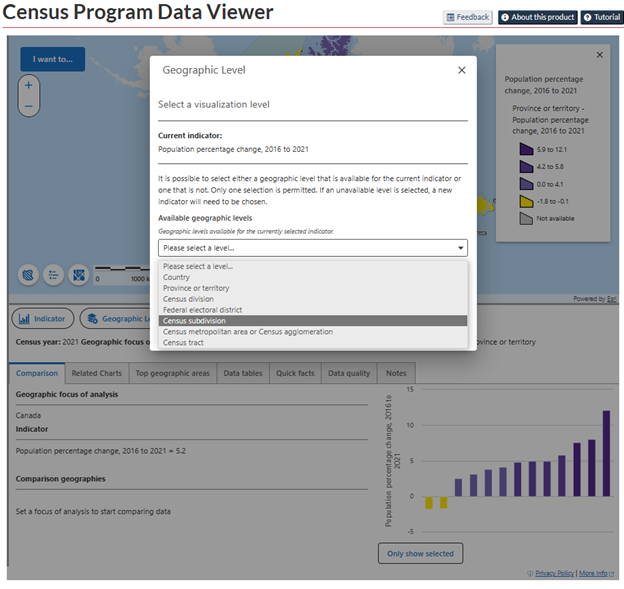
Click the "Geographic level" button and select "Census subdivision."
-
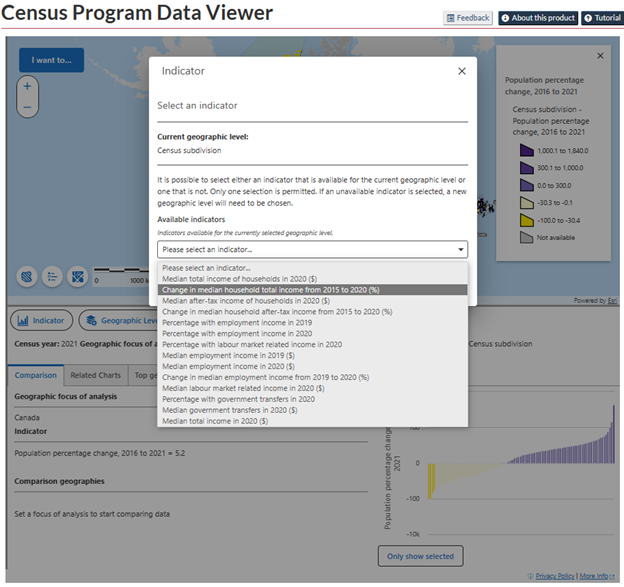
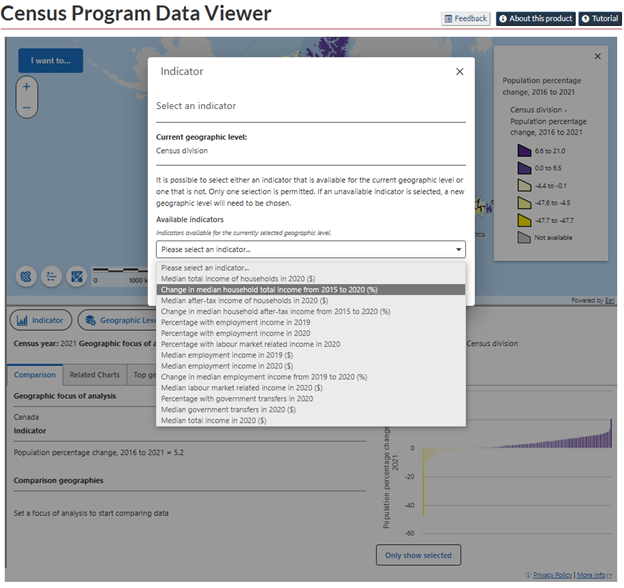
Select the "Change in median household total income from 2015 to 2020 (%)" indicator available in the income topic as per the "Select an indicator" tutorial.
-
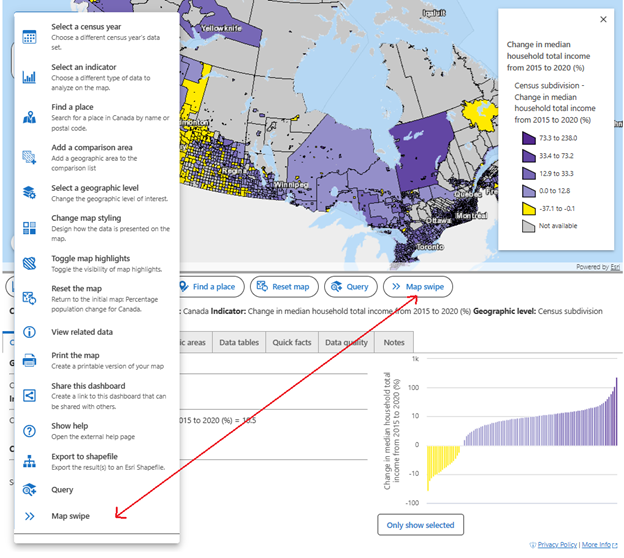
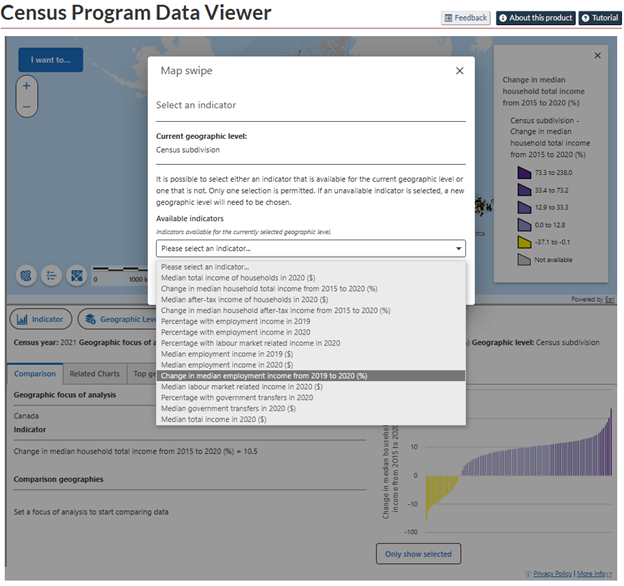
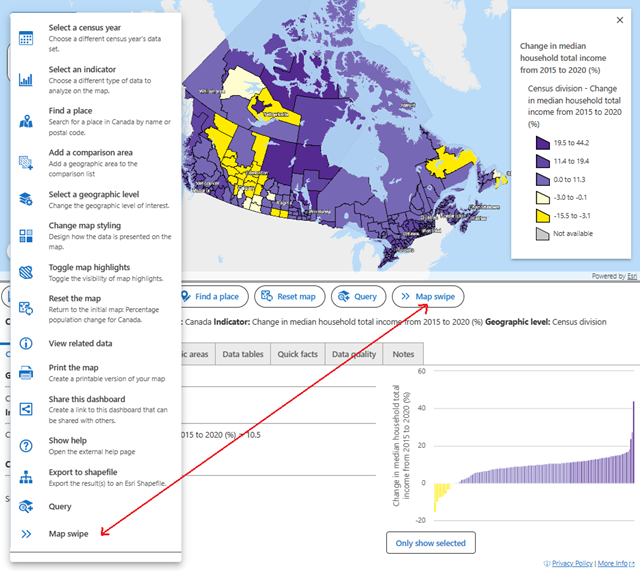
Click the "I want to" button and select "Map swipe." Alternatively, you can click the "Map swipe" button located below the map.
-
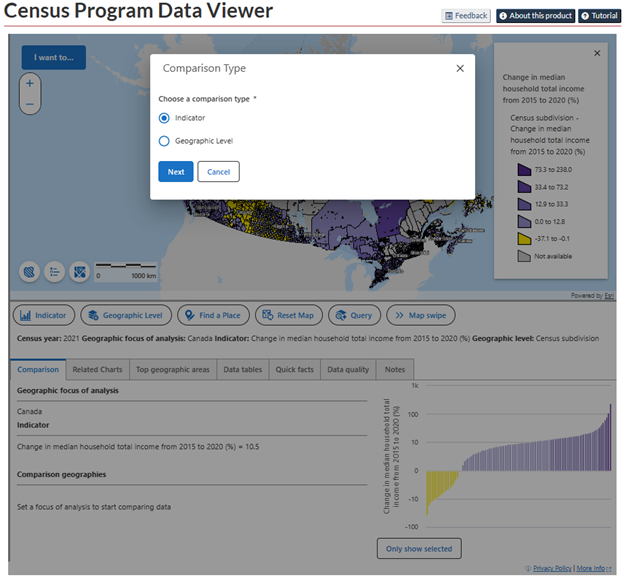
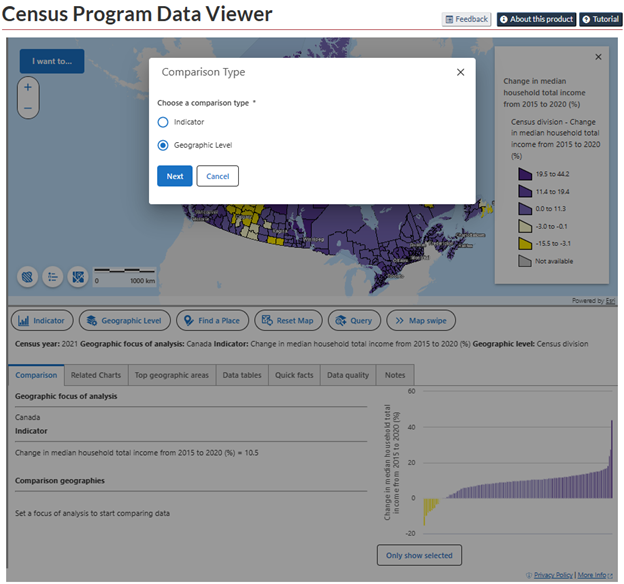
Click the "Indicator" radio button and then "Next."
-
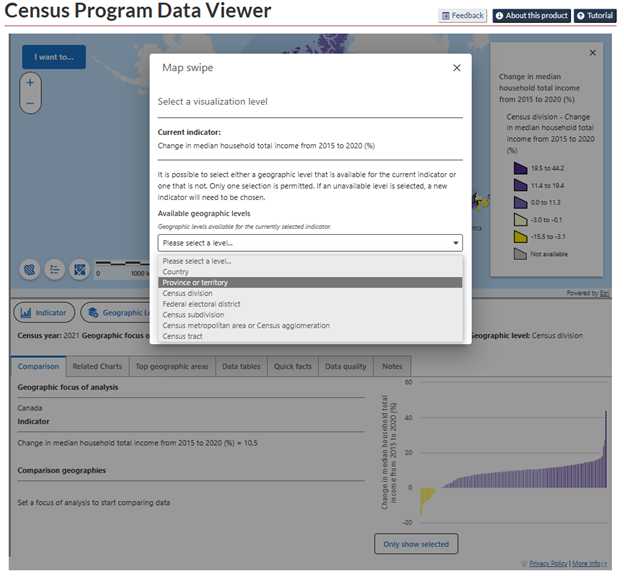
Similarly to Step 2, select the "Change in median employment income from 2019 to 2020 (%)" indicator.
-
The CPDV will now display both indicators simultaneously.
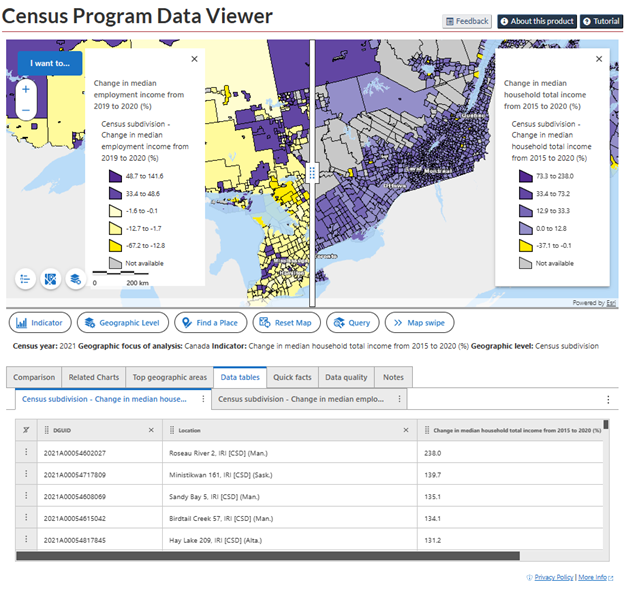
The right side of the map shows the first indicator selected (Change in median household total income from 2015 to 2020 (%)) and the left side of the map the second one selected (Change in median employment income from 2019 to 2020 (%)).
You can drag the bar that splits both sides of the map left or right to dynamically see the difference between both indicators. You can also drag and zoom into the map to focus on specific locations.
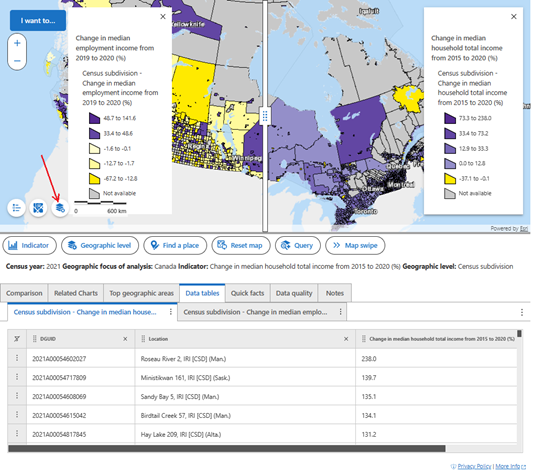
You can also change geographic levels by following Step 1 instructions.
-
Click the "Exit map swipe" button located on the map to exit "Map swipe."
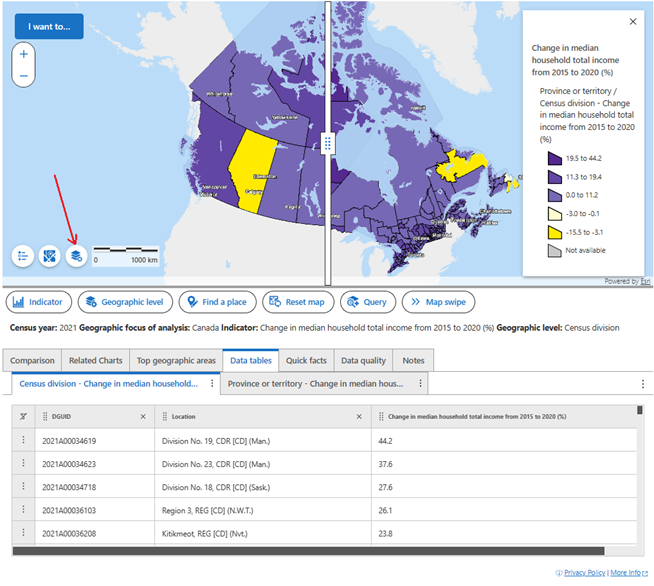
Compare a mappable indicator between two geographic levels
In this tutorial, we will compare a mappable indicator for two different geographic levels. For this tutorial, we will be comparing an income indicator mapped at the census division and provincial levels.
-
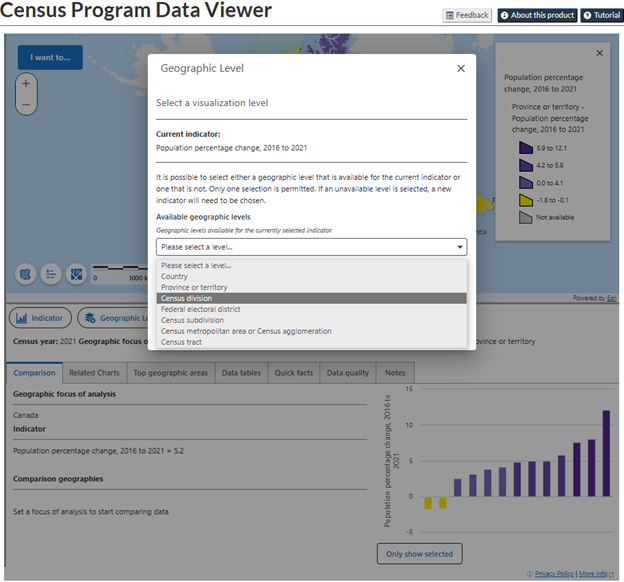
Click the "Geographic level" button situated below the map and select "Census division."
-
Select the "Change in median household total income from 2015 to 2020 (%)" available in the income topic as per the "Select an indicator" tutorial.
-
Click the "I want to" button and select "Map swipe." Alternatively, you can click the "Map swipe" button located below the map.
-
Click the "Geographic Level" radio button and then "Next."
-
Similarly to Step 1, select the "Province or territory" geographic level.
-
The CPDV will now display the selected indicator for both geographic levels simultaneously with the same legend.
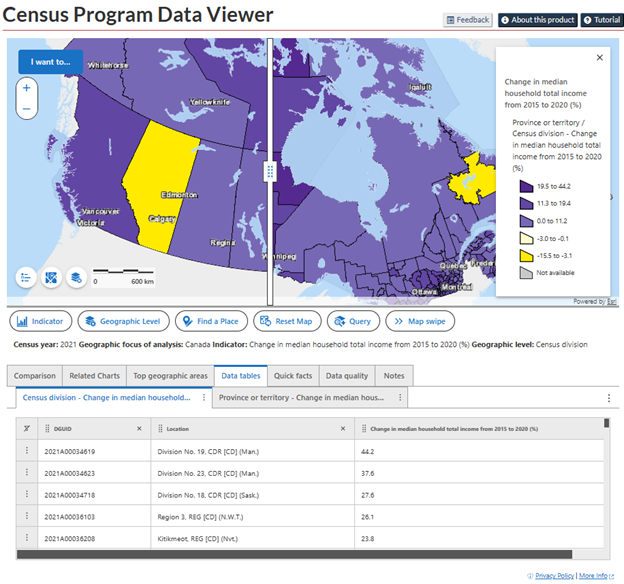
The right side of the map shows the first geographic level selected (census divisions) and the left side of the map the second one selected (provinces or territories).
You can drag the bar that splits both sides of the map left or right to dynamically see the difference between both geographic levels. You can also drag and zoom into the map to focus on specific locations.
You can also change geographic levels by following Step 2 instructions.
-
Click the "Exit map swipe" button located on the map to exit "Map swipe."
- Date modified: