
Quick Tutorial for the Census Program Data Viewer
The tutorials on this page will show you a few of the most commonly used tools in the Census Program Data Viewer (CPDV) dashboard.
When the CPDV first loads (Figure 1), you will see a thematic map of Canada, showing population percent change from 2016 to 2021 for the provinces and territories. At the bottom of the page is an information panel containing information about the geographic focus and the selected indicator. (By default, these are Canada and population change, respectively.) The panel is updated with different information according to the geographic focus and the selected indicator. At the bottom of the information panel are some tabs that provide further information.
Depending on your screen resolution and zoom preferences you may need to scroll down on your page to see all elements.
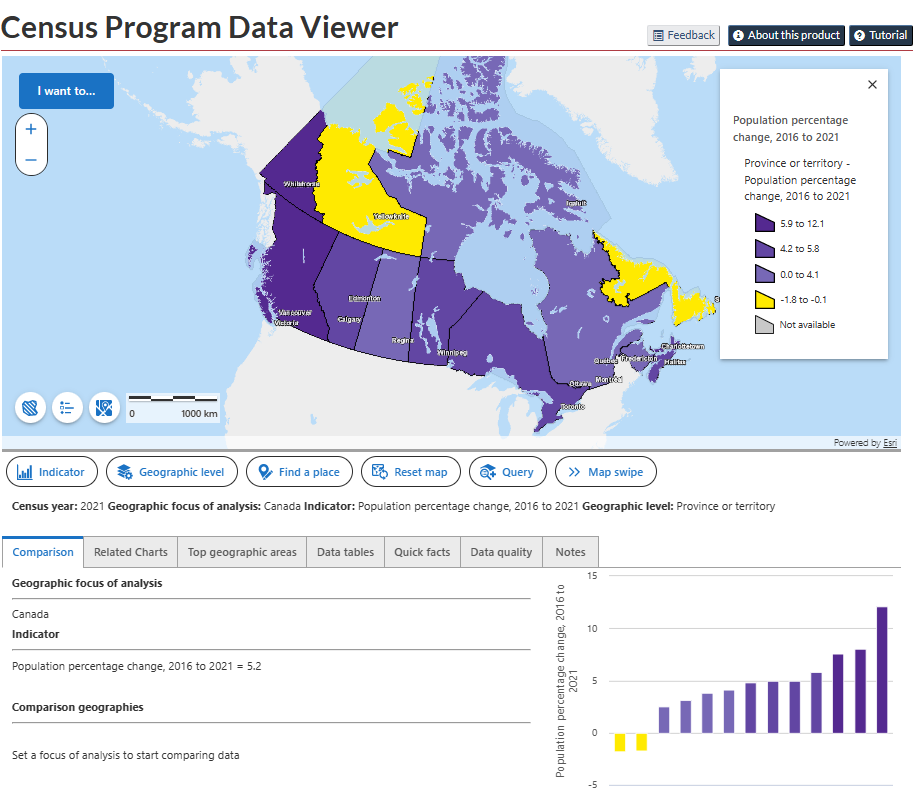
Figure 1 Default view
Tutorials for common tasks
- Date modified: