
Mobility and Migration Reference Guide, Census of Population, 2021
Release date: March 30, 2022 (preliminary) Updated on: October 26, 2022
Skip to text
Text begins
Definitions and concepts
Geographic mobility refers to a population’s geographic movement over time. The Census of Population collects information on a person’s usual place of residence 1 year or 5 years prior to the census reference date (i.e., Census Day). By comparing an individual’s place of residence on a past date with their place of residence on Census Day, information can be obtained on geographic mobility, for example, mobility status (i.e., whether the person is living at the same usual place of residence as 1 year or 5 years ago) and past location of residence (1 year or 5 years ago).
Mobility information collected through the census can be divided into two categories: mobility status 1 or 5 years ago and location of residence 1 or 5 years ago.
Mobility data pertaining to 1 year ago includes all persons 1 year of age and older living in private households. Mobility data pertaining to 5 years ago includes all persons 5 years of age and older living in private households.
Mobility status
Mobility status refers to the status of a person with regard to their place of residence on Census Day (May 11, 2021) in relation to their place of residence on the same date 1 or 5 years earlier.
Persons who, on Census Day, lived in the same residence as they did on the same date 1 year or 5 years earlier are referred to as non-movers, and persons who, on Census Day, did not live in the same residence as they did 1 year or 5 years earlier are referred to as movers.
Movers include non-migrants and migrants.
Non-migrants are movers who lived in the same census subdivision on Census Day as they did on the same date 1 year or 5 years earlier.
Migrants include internal migrants and external migrants.
Internal migrants include migrants who lived in Canada 1 year or 5 years ago. This includes persons who moved to a different city, town, township, village, municipality or Indian reserve within Canada. Greater detail can be provided for internal migrants by identifying whether they crossed a provincial boundary or the limits of a large municipality, specifically a census metropolitan area (CMA) or census agglomeration (CA).
External migrants include migrants who did not live in Canada 1 year or 5 years ago.
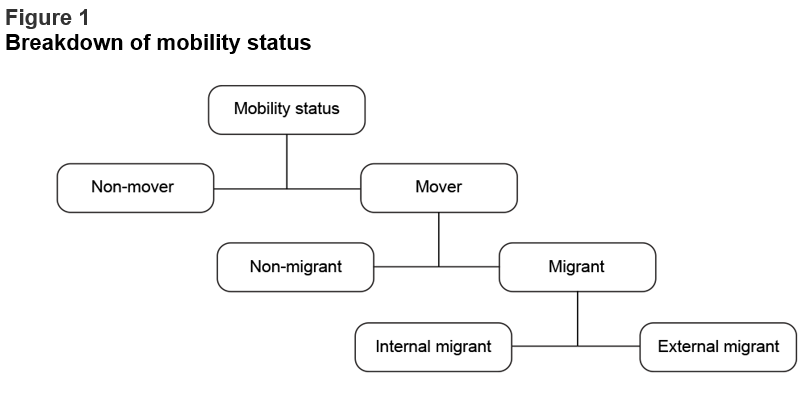
Description for Figure 1
This figure illustrates the breakdown of mobility status.
Mobility status is divided into movers and non-movers.
The status “mover” is divided further into non-migrant and migrant.
Migrant is divided further into either internal migrant or external migrant.
Location of residence
Location of residence refers to a person’s usual place of residence 1 year or 5 years prior to Census Day.
For persons who resided in Canada at the earlier time, location of residence 1 year or 5 years ago is produced for census subdivision, census division and province of residence. Additionally, geographic information is produced for CMA of residence, Statistical Area Classification of residence and census subdivision type of residence 1 or 5 years ago.
For persons who resided outside Canada at the earlier time, country of residence 1 or 5 years ago is produced.
Below is a list of mobility location of residence variables for 1 year or 5 years ago that either appear in disseminated tables or are available as custom data requests:
- Mobility 1 – Statistical Area Classification of residence 1 year ago
- Mobility 1 – Census division of residence 1 year ago
- Mobility 1 – Census metropolitan area or census agglomeration of residence 1 year ago
- Mobility 1 – Census subdivision of residence 1 year ago
- Mobility 1 – Census subdivision type of residence 1 year ago
- Mobility 1 – Components of migration (in and out) 1 year ago
- Mobility 1 – Country of residence 1 year ago
- Mobility 1 – Province or territory of residence 1 year ago
- Mobility 5 – Statistical Area Classification of residence 5 years ago
- Mobility 5 – Census division of residence 5 years ago
- Mobility 5 – Census metropolitan area or census agglomeration of residence 5 years ago
- Mobility 5 – Census subdivision of residence 5 years ago
- Mobility 5 – Census subdivision type of residence 5 years ago
- Mobility 5 – Components of migration (in and out) 5 years ago
- Mobility 5 – Country of residence 5 years ago
- Mobility 5 – Province or territory of residence 5 years ago
For additional information, please see the Dictionary, Census of Population, 2021, Statistics Canada Catalogue no. 98-301-X.
Questions
For the 2021 Census, the mobility questions are asked on the Census of Population long-form questionnaire. The 2A short-form questionnaire was used to enumerate all usual residents of 75% of private dwellings. The 2A-L long-form questionnaire, which also includes the questions from the 2A short-form questionnaire, was used to enumerate a 25% sample of private households in Canada. For private households in First Nations communities, Métis settlements, Inuit regions and other remote areas, the 2A-R questionnaire was used to enumerate 100% of the population.
Mobility and migration data were collected from Question 31, location of residence 1 year ago and Question 32, location of residence 5 years ago. The mobility questions are unchanged from 2016. See the screenshots below for details on question layout and format.
The mobility questions appearing on the 2A-L and 2A-R questionnaires collect the same information. The only difference between the questions on these two forms is in the notes and example sections. On the 2A-L questionnaire, the note for the mobility questions instructs respondents to provide the name of the city or town in which they lived 1 year or 5 years ago, instead of the CMA their city or town is a part of. On the 2A-R questionnaire, the note for the mobility questions instructs respondents to provide the name of the community, municipality or Indian reserve in or on which they lived 1 year or 5 years ago, rather than the name of the First Nation or Indian Band. For example, a respondent should write “Lac Brochet 197A, Manitoba,” instead of “Northlands Denesuline First Nation.”
For more information on the reasons why the census questions are asked, please refer to the five fact sheets found on The road to the 2021 Census web page.
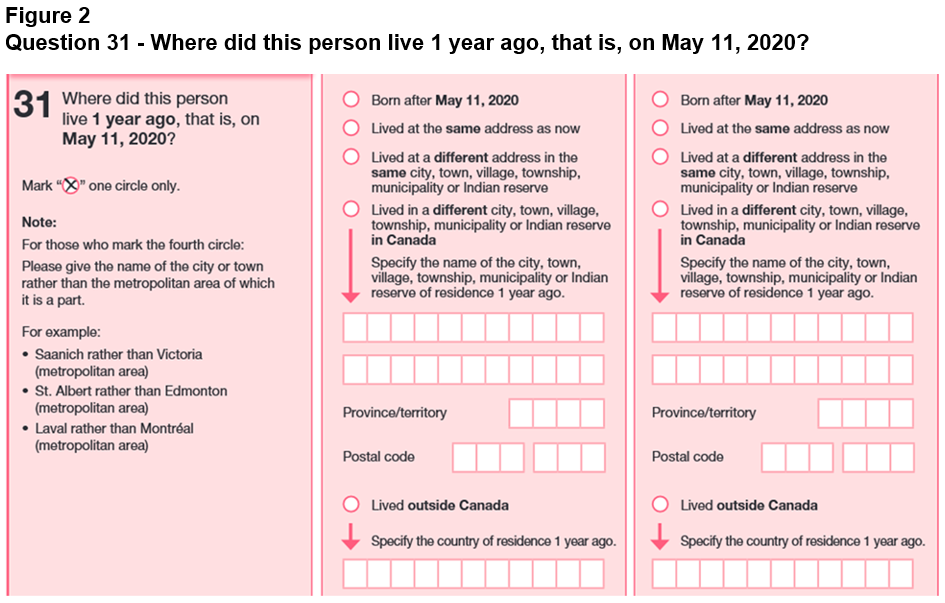
Description for Figure 2
- The title of this figure is “Where did this person live 1 year ago, that is, on May 11, 2020?”
- This figure is a screenshot of Question 31 on the paper questionnaire.
- Mark “X” one circle only. Note: For those who mark the fourth circle: Please give the name of the city or town rather than the metropolitan area of which it is a part.
For example:- Saanich rather than Victoria (metropolitan area)
- St. Albert rather than Edmonton (metropolitan area)
- Laval rather than Montréal (metropolitan area)
- To the right of the question text, there are five radio buttons where you select your answer. The options are:
- Born after May 11, 2020
- Lived at the same address as now
- Lived at a different address in the same city, town, village, township, municipality or Indian reserve
- Lived in a different city, town, village, township, municipality or Indian reserve in Canada. Specify the name of the city, town, village, township, municipality or Indian reserve of residence one year ago. Below this option, there is an edit field than can be used to enter the city, town, village, township, municipality or Indian reserve of residence. There are two other edit fields that can be used to enter the province or territory and the postal code.
- Lived outside Canada. Specify the country of residence 1 year ago. Below this option, there is an edit field that can be used to enter the country.
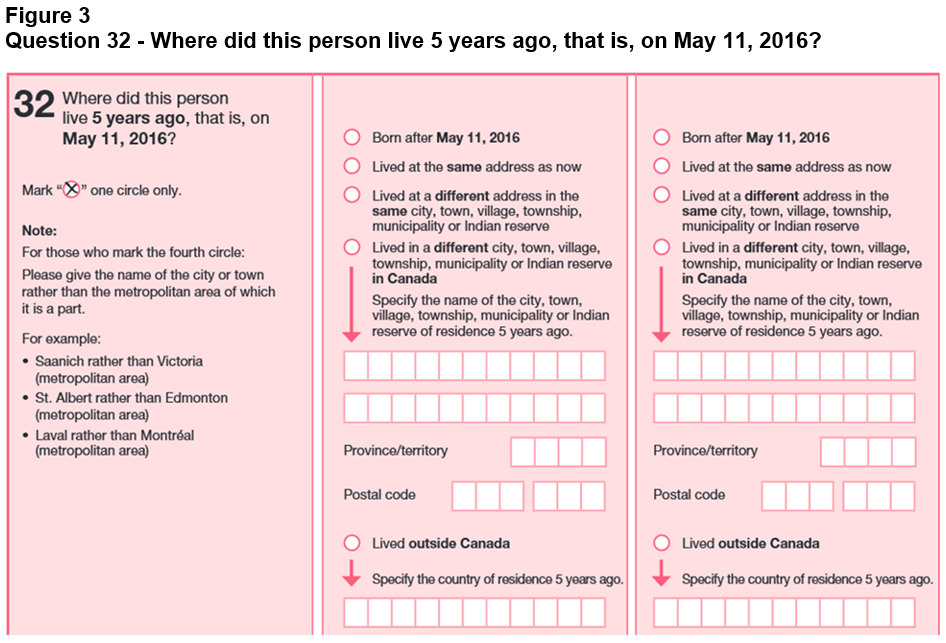
Description for Figure 3
- The title of this figure is “Where did this person live 5 years ago, that is, on May 11, 2016?”
- This figure is a screenshot of Question 32 on the paper questionnaire.
- Mark “X” one circle only. Note: For those who mark the fourth circle: Please give the name of the city or town rather than the metropolitan area of which it is a part.
For example:- Saanich rather than Victoria (metropolitan area)
- St. Albert rather than Edmonton (metropolitan area)
- Laval rather than Montréal (metropolitan area)
- To the right of the question text, there are five radio buttons where you select your answer. The options are:
- Born after May 11, 2016
- Lived at the same address as now
- Lived at a different address in the same city, town, village, township, municipality or Indian reserve
- Lived in a different city, town, village, township, municipality or Indian reserve in Canada. Specify the name of the city, town, village, township, municipality or Indian reserve of residence 5 years ago. Below this option, there is an edit field than can be used to enter the city, town, village, township, municipality or Indian reserve. There are two other edit fields that can be used to enter the province or territory and the postal code.
- Lived outside Canada. Specify the country of residence 5 years ago. Below this option, there is an edit field that can be used to enter the country.
Classifications
All mobility variables are based on Statistics Canada’s standard definitions. These standards cover the variables mobility status 1 and 5 years ago and location of residence 1 and 5 years ago. Below is a list of links to Statistics Canada’s standard definitions of mobility and migration:
- Mobility status, one year
- Location of residence one year ago
- Mobility status, five years
- Location of residence five years ago
Concepts over time
Mobility data have been collected in every Canadian Census of Population from 1961 to 2016, with the exception of 1966. In 2011, mobility data were collected through the National Household Survey. For the 2021 Census, the concepts mobility status and location of residence 1 year and 5 years ago are the same as they were in these previous census cycles.
Collection and processing methods
In the processing of mobility variables, Statistics Canada uses record linkage with the previous census, tax data and immigration data through a secure environment to perform data validation and improve data quality.
The COVID-19 pandemic emerged in Canada in early 2020 and affected all steps of the 2021 Census process, from data collection to dissemination. Please refer to the Guide to the Census of Population, 2021, Statistics Canada Catalogue no. 98-304-X for more detailed information on this topic.
For information on collection and processing methods, please refer to the Guide to the Census of Population, 2021, Statistics Canada Catalogue no. 98-304-X.
Data quality
The 2021 Census of Population underwent a thorough data quality assessment. The different certification activities conducted to evaluate the quality of the 2021 Census data are described in Chapter 9 of the Guide to the Census of Population, 2021, Statistics Canada Catalogue no. 98-304-X.
The data quality assessment was conducted in addition to the regular verifications and quality checks completed at key stages of the census. For example, throughout data collection and processing, the accuracy of specific steps such as data capture and coding was measured, the consistency of the responses provided was checked, and the non-response rates for each question were analyzed. As well, the quality of imputed responses was assessed during data editing and imputation.
During the data quality assessment, a number of data quality indicators were produced and used to evaluate the quality of the data. These indicators are briefly described below. Finally, resulting census counts were compared with other data sources and certified for final release.
The main highlights of this assessment of the data pertaining to Mobility and Migration are presented below.
Variability due to sampling and total non-response
The objective of the long-form census questionnaire is to produce estimates on various topics for a wide variety of geographies, ranging from very large areas (such as provinces and census metropolitan areas) to very small areas (such as neighbourhoods and municipalities), and for various populations (such as Indigenous peoples and immigrants) that are generally referred to in this document as “populations of interest.” In order to reduce response burden, the long-form census questionnaire is administered to a random sample of households.
This sampling approach and total non-response introduce variability into the estimates that needs to be accounted for. This variability also depends on the population size and the variability of the characteristics being measured. Furthermore, the precision of estimates may vary considerably depending on the domain or geography of interest, in particular because of the variation in response rates. For more information on variability due to sampling and total non-response in long-form census questionnaire estimates, please refer to the Guide to the Census of Population, 2021, Statistics Canada Catalogue no. 98-304-X.
Non-response bias
Non-response bias is a potential source of error for all surveys, including the long-form census questionnaire. Non-response bias arises when the characteristics of those who participate in a survey are different from those who do not.
In general, the risk of non-response bias increases as the response rate declines. For the 2021 long-form census questionnaire, Statistics Canada adapted its collection and estimation procedures to mitigate the effect of non-response bias to the extent possible. For more information on these mitigation strategies, please refer to the Guide to the Census of Population, 2021, Statistics Canada Catalogue no. 98-304-X.
Data quality indicators
A number of quality indicators were produced and analyzed during the 2021 Census of Population data quality assessment. Four indicators are available to data users for long-form content: the total non-response (TNR) rate; the confidence interval; as well as the non-response rate and the imputation rate per question.
The total non-response (TNR) rate is the primary quality indicator that accompanies each disseminated 2021 Census of Population product, and is calculated for each geographic area. It measures total non-response at the dwelling level. Non-response is said to be total when no questionnaire is returned from a dwelling or when a returned questionnaire does not meet the minimum content. More information on the TNR rate is available in Chapter 9 of the Guide to the Census of Population, 2021, Statistics Canada Catalogue no. 98-304-X.
The confidence interval was selected as a variance-based quality indicator to accompany the 2021 Census of Population long-form estimates because it helps users easily make a statistical inference. This indicator provides a measure of the accuracy of the long-form estimates. Using a science-based approach, research and simulations were done to ensure that confidence intervals are constructed using adequate statistical methods for the Census of Population data and areas of interest.
A confidence interval is associated with a confidence level, generally set at 95%. A 95% confidence interval is an interval constructed around the estimate so that, if the process that generated the sample were repeated many times, the value of the interest parameter in the population would be contained in 95% of these intervals. The confidence interval consists of a lower bound and an upper bound. These two bounds accompany the long-form estimates in most data tables.
Further details on the different methods used to construct confidence intervals and their assumptions are provided in the Sampling and Weighting Technical Report, Census of Population, 2021, Statistics Canada Catalogue no. 98-306-X.
The non-response rate per question is a measure of missing information due to non-response to a question. It measures only the non-response that is resolved through imputation during data processing (as opposed to weighting when a sample is used). For the long-form questionnaire, the non-response rate per question includes only partial non-response to the question, except for First Nations communities, Métis settlements, Inuit regions and other remote areas where both partial and total non-response are taken into account. Partial non-response is when answers to certain questions are not provided for a respondent household.
The non-response rate per question for a question on the long-form questionnaire is defined as the sum of the weights of in-scope units in the population of interest who did not respond to the question divided by the sum of the weights of in-scope units in the population of interest. Here “units” refers to the statistical units for which data are collected or derived (e.g., persons or households, depending on whether the question is about a person-level characteristic or a household-level characteristic). A unit is considered to be in scope for a given question if the question is applicable to that unit and the unit belongs to the population of interest related to the question.
The imputation rate per question measures the extent to which responses to a given question were imputed. Imputation is used to replace missing data in the event of non-response or when a response is found to be invalid (e.g., multiple answers are provided when a single answer is expected). Imputation is conducted to eliminate data gaps and to reduce bias introduced by non-response. Imputation is generally done by identifying persons or households in the same geographical area with similar characteristics to the incomplete record and copying their values to fill in the missing or invalid responses.
The imputation rate for a question on the long-form questionnaire is defined as the sum of the weights of in-scope units in the population of interest for which the response to the question was imputed divided by the sum of the weights of in-scope units in the population of interest (see the definition of “units” provided in the above section on the non-response rate per question).
For long-form content, imputation for most areas is done to resolve partial non-response—not total non-response, which instead is treated by weighting. However, in First Nations communities, Métis settlements, Inuit regions and other remote areas, whole household imputation (WHI) is used to resolve total non-response. It first imputes the occupancy status of non-respondent dwellings and further imputes all the data for those dwellings resolved as occupied in the first step. WHI is included in the imputation rate per question, including the use of administrative data to impute non-responding households in areas with low response rates; see Appendix 1.7 of the Guide to the Census of Population, 2021, Statistics Canada Catalogue no. 98-304-X. As with the non-response rate, a unit is considered to be in scope if the question is applicable to that unit and the unit belongs to the population of interest related to the question.
The non-response and imputation rates per question can be interpreted as the proportion of in-scope units in the population of interest for which information was not reported or was imputed, respectively. The long-form rates are weighted to reflect the fact that the long-form questionnaire is only distributed to a sample of the population, so in this case, the proportion is estimated.
The non-response and imputation rates for a question are often similar, but some differences can be observed for a given question because of additional data processing steps that may have been required. These rates were regularly checked during data assessment, and a detailed analysis was done if there was a difference between the two rates for a question, to ensure the appropriateness of the processing steps taken and the quality of the data. A difference between the non-response rate and the imputation rate for a question can generally be explained by one of the following two factors:
- Some responses were considered invalid or inconsistent during the edit stage and imputation was needed, which is why the imputation rate is higher than the non-response rate for a question.
- Some non-responses were resolved in a straightforward manner early during data processing because a single resolution was possible based on the answers provided to other questions, making imputation unnecessary. This may explain why the non-response rate is higher than the imputation rate for a question.
Table 1 below presents the non-response and imputation rates for Mobility status 1 year ago and Mobility status 5 years ago for Canada and for each province and territory.
| Geography | Mobility status 1 year ago | Mobility status 5 years ago | ||
|---|---|---|---|---|
| Non-response rate | Imputation rate | Non-response rate | Imputation rate | |
| percent | ||||
| Canada | 1.3 | 1.5 | 1.4 | 2.1 |
| Newfoundland and Labrador | 1.2 | 1.3 | 1.2 | 1.7 |
| Prince Edward Island | 0.7 | 1.0 | 0.9 | 1.7 |
| Nova Scotia | 1.0 | 1.8 | 1.1 | 3.2 |
| New Brunswick | 1.2 | 1.4 | 1.3 | 1.9 |
| Quebec | 1.1 | 1.3 | 1.2 | 1.8 |
| Ontario | 1.0 | 1.3 | 1.1 | 2.1 |
| Manitoba | 2.2 | 2.4 | 2.2 | 2.8 |
| Saskatchewan | 2.3 | 2.4 | 2.3 | 2.8 |
| Alberta | 1.6 | 1.8 | 1.7 | 2.3 |
| British Columbia | 1.4 | 1.6 | 1.5 | 2.1 |
| Yukon | 5.1 | 5.3 | 5.2 | 5.7 |
| Northwest Territories | 9.8 | 9.9 | 9.8 | 10.3 |
| Nunavut | 25.0 | 25.1 | 25.0 | 25.4 |
| Source: Statistics Canada, Census of Population, 2021. | ||||
Two types of imputation are reflected in the imputation rate: long-form total non-response (TNR) and question-level imputation as a result of non-response and invalid responses. At the national level, long-form TNR accounted for 18.9% of all imputed records for mobility status 1 year ago and 13.2% of all imputed records for mobility status 5 years ago in 2021. The difference between these variables is a result of differing age thresholds for the population of interest for the two variables.
At the provincial and territorial levels for mobility status 1 year ago, long-form TNR accounted for between 8.9% of all imputed records in Prince Edward Island and 80.3% of all imputed records in Nunavut. Similarly, for mobility status 5 years ago, long-form TNR accounted for between 5.2% of all imputed records in Prince Edward Island and 79.9% of all imputed records in Nunavut.
The non-response and imputation rates per question at lower levels of geography are also available in 2021 Census data tables presenting data quality indicators. This information is scheduled for release on August 17, 2022, for short-form questions and on November 30, 2022, for long-form questions.
The 2021 Census Data Quality Guidelines, Statistics Canada Catalogue no. 98-26-0006 provides all the information required to understand and interpret the data quality indicators for the 2021 Census, along with guidelines to enable their proper usage. Data quality indicators are provided so that users are informed about the quality of the statistical information and can determine the relevance and the limitations of the data relative to their needs. In general, the quality of the 2021 Census of Population data is very good, but in some cases, data have to be used with caution. It is strongly recommended that users consult all available data quality indicators to get a better sense of the quality of the data products they are interested in.
Certification of final counts
Once data editing and imputation were completed, the data were weighted to ensure that estimates represent the total Canadian population living in private dwellings. Certification of the final weighted estimates was the last step in the validation process, which led to the recommendation to release the data for each level of geography and domain of interest. Based on the analysis of the data quality indicators and the comparison of long-form census questionnaire estimates with other data sources, the recommendation is for unconditional release, conditional release, or non-release (for quality reasons on rare occasions). For conditional release or non-release, appropriate notes and warnings are included in the products and provided to users. Moreover, other data sources were used to evaluate the long-form census questionnaire estimates. However, since the risk of error often increases for lower levels of geography and for smaller populations, and the data sources used to evaluate these counts are less reliable or not available at these lower levels, it can be difficult to certify the counts at these levels.
Long-form census questionnaire estimates are also subject to confidentiality rules that ensure non-disclosure of respondent identity and characteristics. For more information on privacy and confidentiality, please refer to Chapter 1 of the Guide to the Census of Population, 2021, Statistics Canada Catalogue no. 98-304-X. For information on how Statistics Canada balances the protection of confidentiality and the need for disaggregated census data, with specific attention to new 2021 Census content, please refer to Balancing the Protection of Confidentiality with the Needs for Disaggregated Census Data, Census of Population, 2021, Statistics Canada Catalogue no. 98-26-0005.
For more information on data processing and the calculation of estimates and their level of precision, please refer to the Sampling and Weighting Technical Report, Census of Population, 2021, Statistics Canada Catalogue no. 98-306-X.
Comparability with other data sources
As a standard practice, the quality of the 2021 Census mobility and migration information was evaluated internally before publication. The data were compared, to the extent possible, with alternative data sources.
Migration flows created from mobility data, for 1-year and 5-year time periods, were compared with migration estimates derived from Statistics Canada’s Demographic Estimates Program. The Demographic Estimates Program bases its migration model on T1 tax data and Canada Child Benefit data. Estimates of internal migrants based on the 2021 Census are, in general, lower than those derived from administrative data.
Although they measure slightly different concepts, country of residence data for 1 year and 5 years ago are generally comparable to administrative data from Immigration, Refugees and Citizenship Canada.
Data quality notes
Estimates of internal migration may be less accurate for small geographic areas, areas with a place name that is duplicated elsewhere, and some CSDs where residents may have provided the name of the CMA or CA instead of the specific name of the component CSD from which they migrated.
- Date modified: