
A portrait of Canada’s growing population aged 85 and older from the 2021 Census
Skip to text
Text begins
Highlights
- Over 861,000 people aged 85 and older were counted in the 2021 Census, more than twice the number observed in the 2001 Census.Note 1
- The population aged 85 and older is one of the fastest-growing age groups, with a 12% increase from 2016. Currently, 2.3% of the population is aged 85 and older.
- While the COVID-19 pandemic claimed many lives among the oldest Canadians, this population continued to grow rapidly.
- Over the next 25 years (by 2046), the population aged 85 and older could triple to almost 2.5 million people.
- Over 9,500 centenarians are now living in Canada — a 16% increase from 2016. Centenarians represent 0.03% of the Canadian population.
- While women still outnumber men, the ratio of women to men among people aged 85 and older is decreasing.
- As a significant proportion of people aged 85 and older have activity limitations or health-related issues, more than one-quarter live in a collective dwelling, such as a nursing care facility, long-term care facility or seniors’ residence. This proportion increases with age.
- Much like young adults, older seniors are also living downtown: in three-fifths of the country’s large urban centres, there is a higher percentage of people aged 85 and older living in the downtown core than in the large urban centre as a whole. Downtown areas tend to have more services and amenities, such as hospitals, long-term care and other housing types better adapted to the specific needs of older populations.
- As more seniors are living to 85 and beyond, an increasing number of individuals will face limitations and long-term health challenges. This will put increasing pressure on all levels of government to ensure adequate support, in areas such as housing, health care and home care, as well as transportation, among other things.
Introduction
Seniors aged 85 and older are growing in number and as a proportion of the population. Despite being impacted by the COVID-19 pandemic, this population continues to increase faster than Canada as a whole. The growth of this population will accelerate even further in coming years, as the first baby boomer cohorts will turn 85.
These older Canadians have contributed greatly to society through their long working lives, by taking care of younger generations, transmitting their experience and knowledge, acting as role models for younger people, and being memory-keepers of the past and of family traditions.
They also have unique needs. Many face activity limitations and need health and home care services — the rapid growth of this population in coming years is likely to add to the existing pressures in the health care and home care sectors. An increasing number are no longer living in private dwellings and need different types of housing options, such as seniors’ residences at first, and nursing care facilities as they get older. Those who stay longer in private homes may have specific needs related to home care, transportation and security.
Today, Statistics Canada takes a closer look at recent trends associated with the population aged 85 and older using 2021 Census data.
The population aged 85 and older has doubled since 2001, and the growth among centenarians was even stronger
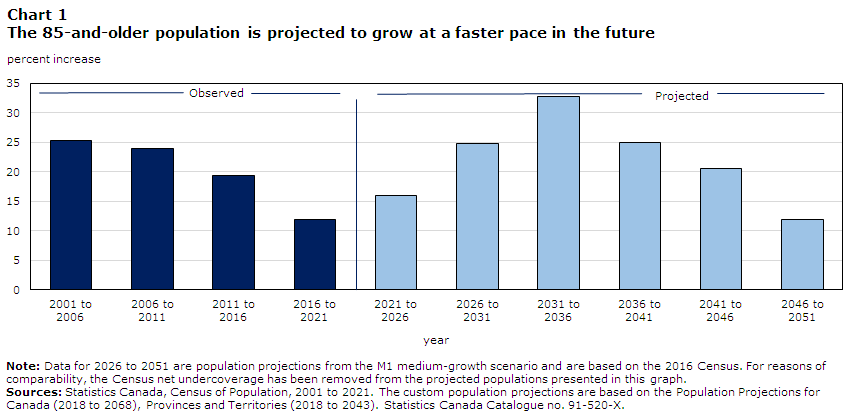
Between 2016 and 2021, the number of people aged 85 and older grew by 12%, which is more than twice as high as the growth seen for the overall Canadian population (+5.2%).
However, this growth of 12% was slightly lower than over the period from 2011 to 2016, when the population aged 85 and older grew by 19%. This was expected, because the cohorts turning 85 between 2016 and 2021 were smaller. Seniors who turned 85 during this period were born at the start of the Great Depression in 1929, at a time when Canada’s fertility decreased.
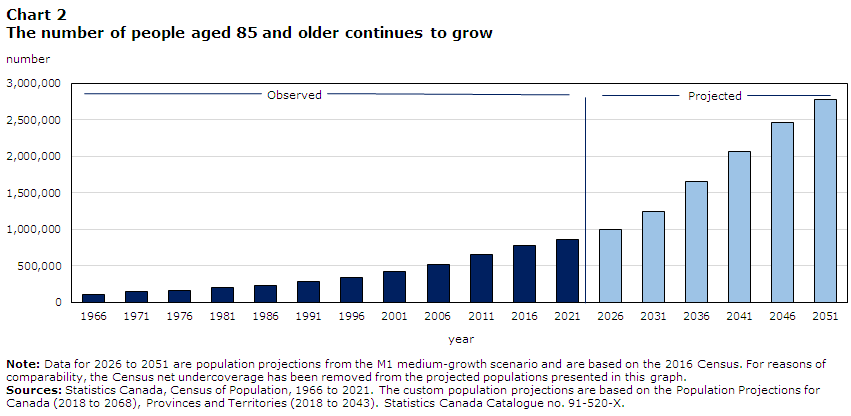
Still, over 861,000 people aged 85 and older were enumerated in the 2021 Census, representing 2.3% of the population. This is over 90,000 more people than in 2016 and twice as many as in the 2001 Census.
The centenarian population (aged 100 years and older) grew at an even faster rate. This population increased by 16% between 2016 and 2021. Now, just over 9,500 people are 100 years of age or older, or 0.03% of the population.
Three times more people aged 85 and older by 2050
Although the growth rate of the population aged 85 and older has slowed recently (because of smaller cohorts of seniors turning 85), it is likely to increase in the coming years. Population projections show that growth could peak between 2031 and 2036, as the first cohorts of baby boomers reach 85 years of age.Note 2
Such rapid increases in the number of the oldest Canadians are explained by a combination of two things. First, larger cohorts will reach the age of 85 starting in 2031 because the baby boomers, born between 1946 and 1965, are the largest generation in Canadian history. This generation was born after the Second World War when fertility levels were higher, almost reaching four children per woman. Second, life expectancy has been increasing over the past decades. It increased by almost seven years between 1980 and 2020 and is projected to continue to increase in the upcoming decades.
By 2050, the 85-and-older population could reach more than 2.7 million people, as the last cohort of baby boomers, born in 1965, turns 85. The number of centenarians could also increase rapidly between 2046 and 2065, when many baby boomers will turn 100. By 2065, there is projected to be over 87,500 centenarians in Canada.
In one of the countries with the oldest populations in the world, Japan, 5.1% of the population is currently aged 85 years and older and 0.07% are centenarians.Note 3 Canada is not expected to reach those levels until 2046.
A strong increase in the number of older Canadians will have many implications in terms of health and home care services, housing, transportation, and consumption habits. It will also impact the younger generations and spouses who often care for them. For example, informal care-giving in families tends to be done by women, such that more and more working-age women may find themselves caring for their parents and their children. Further, challenges may persist if shortages in the health care workforce continue.
Additionally, because of declining health with age and increasing activity limitations, older seniors become vulnerable as they age. Adequate measures must be in place to protect them physically and emotionally, as well as financially.
Start of text box 1
For more information on the different age groups and generations in Canada, please see the Daily article “In the midst of high job vacancies and historically low unemployment, Canada faces record retirements from an aging labour force: number of seniors aged 65 and older grows six times faster than children 0-14” and the Census in Brief article “A generational portrait of Canada’s aging population from the 2021 Census.”
For detailed data tables of the age structure and growth for all municipalities in Canada, and at other geographical levels, readers are encouraged to consult Age, Sex at Birth, and Gender Tables.
End of text box 1
Data table for Chart 1
| Percent increase | Observed or projected | |
|---|---|---|
| 2001 to 2006 |
25.2 | Observed |
| 2006 to 2011 |
24.0 | Observed |
| 2011 to 2016 |
19.4 | Observed |
| 2016 to 2021 |
11.8 | Observed |
| 2021 to 2026 |
15.9 | Projected |
| 2026 to 2031 |
24.7 | Projected |
| 2031 to 2036 |
32.7 | Projected |
| 2036 to 2041 |
25.0 | Projected |
| 2041 to 2046 |
20.6 | Projected |
| 2046 to 2051 |
11.9 | Projected |
|
Note: Data for 2026 to 2051 are population projections from the M1 medium-growth scenario and are based on the 2016 Census. For reasons of comparability, the Census net undercoverage has been removed from the projected populations presented in this graph. Sources: Statistics Canada, Census of Population, 2001 to 2021. The custom population projections are based on the Population Projections for Canada (2018 to 2068), Provinces and Territories (2018 to 2043). Statistics Canada Catalogue no. 91-520-X. |
||
Data table for Chart 2
| Number | Observed or projected | |
|---|---|---|
| 1966 | 102,945 | Observed |
| 1971 | 137,385 | Observed |
| 1976 | 164,535 | Observed |
| 1981 | 193,785 | Observed |
| 1986 | 227,765 | Observed |
| 1991 | 283,335 | Observed |
| 1996 | 337,075 | Observed |
| 2001 | 415,905 | Observed |
| 2006 | 520,610 | Observed |
| 2011 | 645,515 | Observed |
| 2016 | 770,780 | Observed |
| 2021 | 861,395 | Observed |
| 2026 | 998,400 | Projected |
| 2031 | 1,245,400 | Projected |
| 2036 | 1,652,100 | Projected |
| 2041 | 2,064,600 | Projected |
| 2046 | 2,459,500 | Projected |
| 2051 | 2,785,000 | Projected |
|
Note: Data for 2026 to 2051 are population projections from the M1 medium-growth scenario and are based on the 2016 Census. For reasons of comparability, the Census net undercoverage has been removed from the projected populations presented in this graph. Sources: Statistics Canada, Census of Population, 1966 to 2021. The custom population projections are based on the Population Projections for Canada (2018 to 2068), Provinces and Territories (2018 to 2043). Statistics Canada Catalogue no. 91-520-X. |
||
Close to two women per man among the 85-and-older population, but the ratio is decreasing
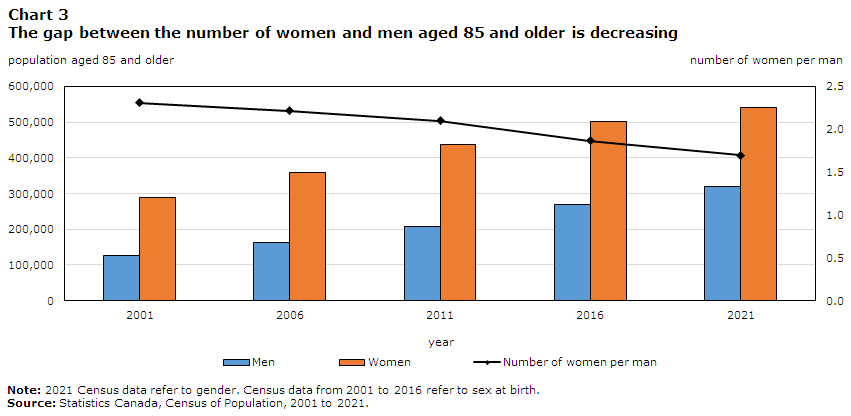
Although the majority of people aged 85 and older are still women, the census shows that the number of men in that age group is increasing at a faster pace. In 2021, there were 1.7 women for every man aged 85 and older compared with 1.9 persons of female sex for every person of male sex in 2016.Note 4 This is because of stronger increases since the end of the 1970s in life expectancy for men, meaning that the gap between the number of men and the number of women in this age group is shrinking.
This trend is even more pronounced among centenarians. There were just over five persons of female sex for every person of male sex aged 100 and older in 2016. By 2021, this had fallen to just over four women for every man.
Differences in the number of men and women can have implications on the lives of older Canadians, particularly women. Living alone, especially after the loss of a spouse, can lead to feelings of loneliness and social isolation, which in turn can have health consequences.
In the coming months, other releases from the Census of Population will provide a better understanding of the differences in the lives of older women and older men, notably in releases showing data on couples, people living alone and income.
Data table for Chart 3
| Men | Women | Number of women per man | |
|---|---|---|---|
| population aged 85 and older | |||
| 2001 | 125,585 | 290,330 | 2.3 |
| 2006 | 161,925 | 358,685 | 2.2 |
| 2011 | 208,310 | 437,215 | 2.1 |
| 2016 | 268,795 | 501,985 | 1.9 |
| 2021 | 319,540 | 541,860 | 1.7 |
|
Note: 2021 Census data refer to gender. Census data from 2001 to 2016 refer to sex at birth. Source: Statistics Canada, Census of Population, 2001 to 2021. |
|||
More than one in four people aged 85 and older live in a collective dwelling
As abilities decrease and activity limitations increase with age, many people aged 85 and older move from living in private dwellings to living in collective dwellings such as seniors’ residences, nursing care facilities and long-term care facilities — places where they can receive care and support.
In 2021, almost 238,000 people aged 85 and older were living in these collective dwellings, representing close to 3 in 10 people (28%) in this age group.
Start of text box 1
Did you know?
A collective dwelling refers to a dwelling of a commercial, institutional, or communal nature in which a person or group of people resides or could reside. It must provide care or services or have certain common facilities, such as a kitchen or bathroom, which are shared by the occupants. Examples include lodging or rooming houses, hotels, motels, tourist establishments, nursing care facilities, seniors’ residences, hospitals, staff residences, military bases, work camps, correctional facilities and group homes.
The enumeration of collective dwellings underwent substantial changes in the 2021 Census, notably because of the COVID-19 pandemic. Collection procedures were redesigned to ensure that respondents and census employees were safe by limiting the amount of contact for participation in the census. Census employees were not permitted to visit or enter some collective dwellings, especially those housing residents who were vulnerable to COVID-19, such as seniors’ residences and hospitals. For more information about data quality for collective dwellings, refer to the Type of Dwelling Reference Guide, Census of Population, 2021, Statistics Canada Catalogue no. 98-500-X.
End of text box 1
COVID-19, especially at the beginning of the pandemic, had a significant impact on seniors, particularly those living in collective dwellings. With many cases and the fear of infection or strict isolation measures in nursing care facilities and hospitals, some older Canadians may have considered aging in place and delaying their transition to a collective dwelling.
However, with increased precautions taken by the administrators of these residences, and with a large and growing population aged 85 and older, there is still a high number of people in this age group living in collective dwellings. For more information on the impact of the COVID-19 pandemic on people living in certain collective dwellings, please see Impacts of the COVID-19 pandemic in nursing and residential care facilities in Canada.
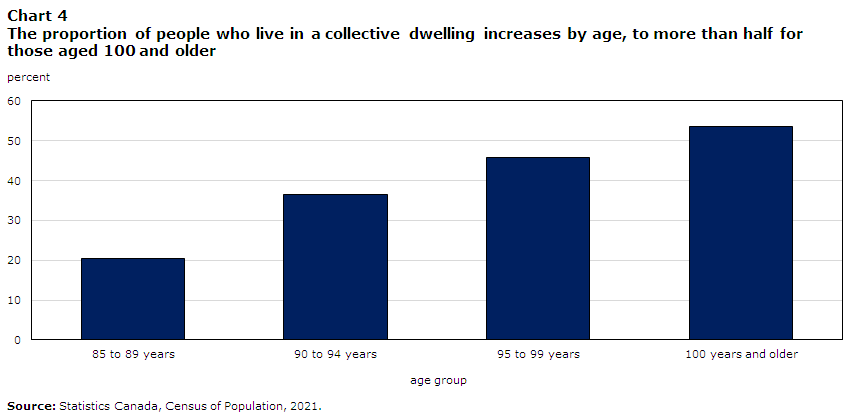
The proportion of people living in collective dwellings increases rapidly with age, from one in five among the 85-to-89 age group to more than half of centenarians.
Moreover, almost three-quarters of residents of collective dwellings aged 85 and older were women, increasing to 85% among centenarians.
Data table for Chart 4
| Age group | Proportion |
|---|---|
| percent | |
| 85 to 89 years | 20.5 |
| 90 to 94 years | 36.4 |
| 95 to 99 years | 45.8 |
| 100 years and older | 53.7 |
| Source: Statistics Canada, Census of Population, 2021. | |
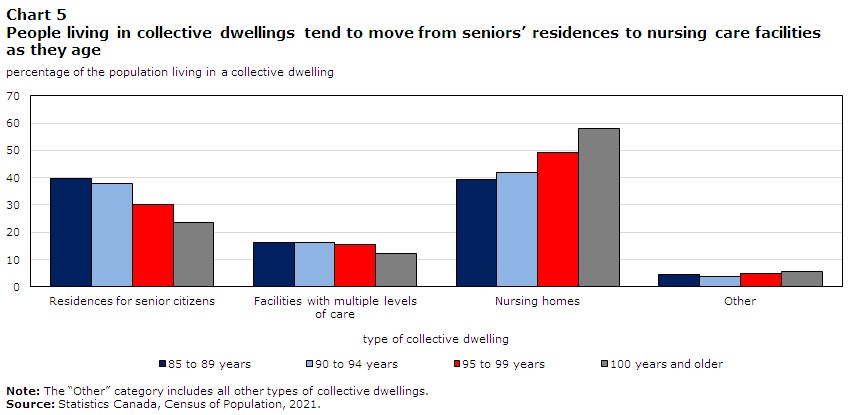
Among older seniors living in collective dwellings, the proportion in nursing care facilities increases with age
The growing number of older seniors increases the demand for health care and access to the types of specialized care provided by seniors’ residences and nursing care facilities. There are now over 100,000 people aged 85 years and older living in nursing care facilities in Canada.
Among Canadians aged 85 and older living in collective dwellings, the proportion of those living in nursing care facilities increases with age, from 40% for people aged 85 to 89 to almost 60% for centenarians.
Conversely, the proportion in seniors’ residences decreases with age from 40% to 24% for the same age groups. This trend is expected as the prevalence of activity limitations and health issues increases with age.
The proportion living in facilities that provide multiple levels of care (both independent living for seniors as well as nursing care) was around 16% for those aged 85 to 89, 90 to 94, and 95 to 99. It fell to 12% for centenarians.
Data table for Chart 5
| Age group | Type of collective dwelling | |||
|---|---|---|---|---|
| Residences for senior citizens | Facilities with multiple levels of care |
Nursing homes | Other | |
| percentage of the population living in a collective dwelling | ||||
| 85 to 89 years | 39.7 | 16.3 | 39.4 | 4.6 |
| 90 to 94 years | 37.9 | 16.4 | 41.9 | 3.8 |
| 95 to 99 years | 30.3 | 15.6 | 49.3 | 4.9 |
| 100 years and older | 23.7 | 12.2 | 58.2 | 5.8 |
|
Note: The “Other” category includes all other types of collective dwellings. Source: Statistics Canada, Census of Population, 2021. |
||||
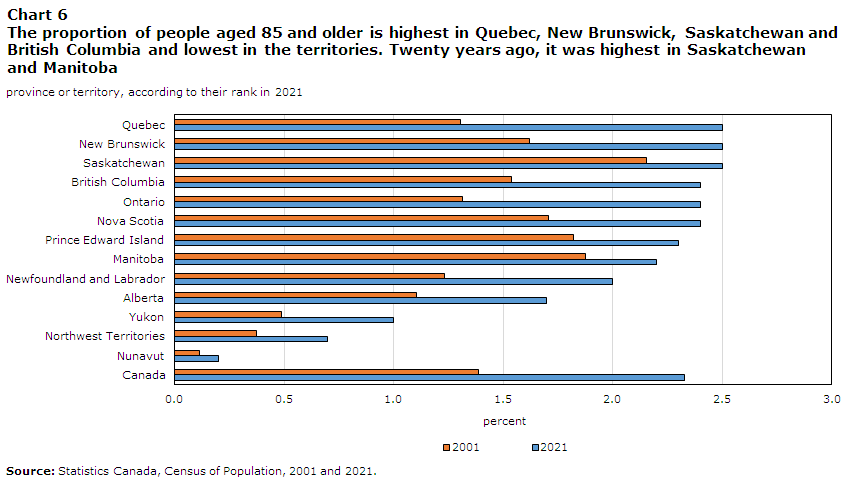
More older Canadians live in Quebec, New Brunswick, Saskatchewan and British Columbia
The proportion of people aged 85 and older was highest in Quebec, New Brunswick, Saskatchewan and British Columbia, resulting mostly from differing trends in fertility, migration and life expectancy between provinces and territories.
For all provinces except Alberta, the proportion of people aged 85 and older was 2% or higher. Each of the three territories had a proportion of people aged 85 and older of 1% or lower: Yukon (1.0%), the Northwest Territories (0.7%) and Nunavut (0.2%). The territories have high fertility — especially in Nunavut — and the lowest life expectancies in Canada. Both of which lead to younger populations.
By 2043, it is projected that Newfoundland and Labrador, Nova Scotia and New Brunswick could have the highest proportions of people aged 85 years and older in Canada, each over 6%. Recent movements of people to the Maritimes may help to increase the health care workforce, volunteer community and tax base these provinces may need in the future to help care for the growing number of seniors. Knowing where older Canadians live — and will live — can help to plan health- and community-services to support their changing needs.
Data table for Chart 6
| Province or territory | Proportion | |
|---|---|---|
| 2021 | 2001 | |
| percent | ||
| Quebec | 2.5 | 1.3 |
| New Brunswick | 2.5 | 1.6 |
| Saskatchewan | 2.5 | 2.2 |
| British Columbia | 2.4 | 1.5 |
| Ontario | 2.4 | 1.3 |
| Nova Scotia | 2.4 | 1.7 |
| Prince Edward Island | 2.3 | 1.8 |
| Manitoba | 2.2 | 1.9 |
| Newfoundland and Labrador | 2.0 | 1.2 |
| Alberta | 1.7 | 1.1 |
| Yukon | 1.0 | 0.5 |
| Northwest Territories | 0.7 | 0.4 |
| Nunavut | 0.2 | 0.1 |
| Canada | 2.3 | 1.4 |
| Source: Statistics Canada, Census of Population, 2001 and 2021. | ||
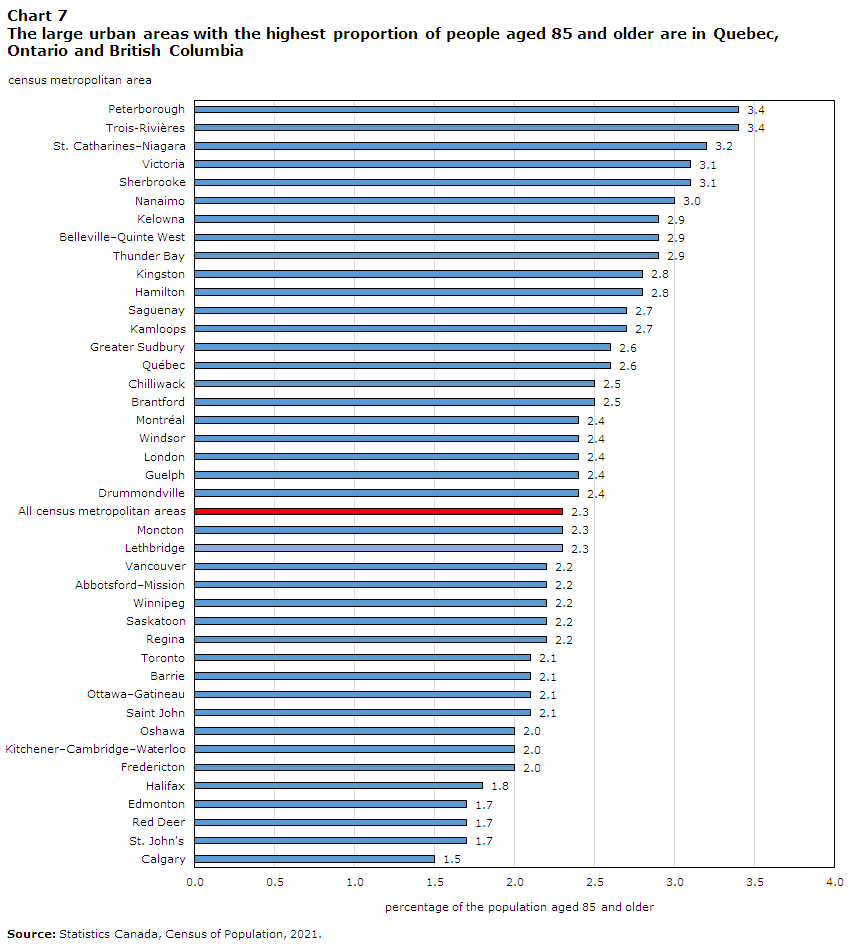
The large urban centres with the highest proportion of people aged 85 and older are in Quebec, Ontario and British Columbia
Large urban centres (also named census metropolitan areas, or CMAs) tend to have younger populations on average than other regions of the country. For large urban centres as a whole, the proportion of people aged 85 and older was 2.3%, compared with 2.5% for the rest of the country.
However, in five large urban centres, the proportion of the population aged 85 and older was greater than 3%: Peterborough (3.4%), Trois-Rivières (3.4%), St. Catharines–Niagara (3.2%), Victoria (3.1%) and Sherbrooke (3.1%).
In five other large urban centres, the proportion of the population aged 85 and older was lower than 2%: Halifax (1.8%); Edmonton, Red Deer and St. John’s (1.7% each); and Calgary (1.5%).
Differences in the proportions of older Canadians in large urban centres are important since these populations have specific needs, such as security, transportation, and access to home and health care services. Seniors may move to cities where these services are already established from smaller urban centres or rural areas when they need more care. This, in turn, may increase the demand for workers and organizations that provide care to older people.
Data table for Chart 7
| Census metropolitan area | Proportion |
|---|---|
| percentage of the population aged 85 and older | |
| Peterborough | 3.4 |
| Trois-Rivières | 3.4 |
| St. Catharines–Niagara | 3.2 |
| Victoria | 3.1 |
| Sherbrooke | 3.1 |
| Nanaimo | 3.0 |
| Kelowna | 2.9 |
| Belleville–Quinte West | 2.9 |
| Thunder Bay | 2.9 |
| Kingston | 2.8 |
| Hamilton | 2.8 |
| Saguenay | 2.7 |
| Kamloops | 2.7 |
| Greater Sudbury | 2.6 |
| Québec | 2.6 |
| Chilliwack | 2.5 |
| Brantford | 2.5 |
| Montréal | 2.4 |
| Windsor | 2.4 |
| London | 2.4 |
| Guelph | 2.4 |
| Drummondville | 2.4 |
| All census metropolitan areas | 2.3 |
| Moncton | 2.3 |
| Lethbridge | 2.3 |
| Vancouver | 2.2 |
| Abbotsford–Mission | 2.2 |
| Winnipeg | 2.2 |
| Saskatoon | 2.2 |
| Regina | 2.2 |
| Toronto | 2.1 |
| Barrie | 2.1 |
| Ottawa–Gatineau | 2.1 |
| Saint John | 2.1 |
| Oshawa | 2.0 |
| Kitchener–Cambridge–Waterloo | 2.0 |
| Fredericton | 2.0 |
| Halifax | 1.8 |
| Edmonton | 1.7 |
| Red Deer | 1.7 |
| St. John's | 1.7 |
| Calgary | 1.5 |
| Source: Statistics Canada, Census of Population, 2021. | |
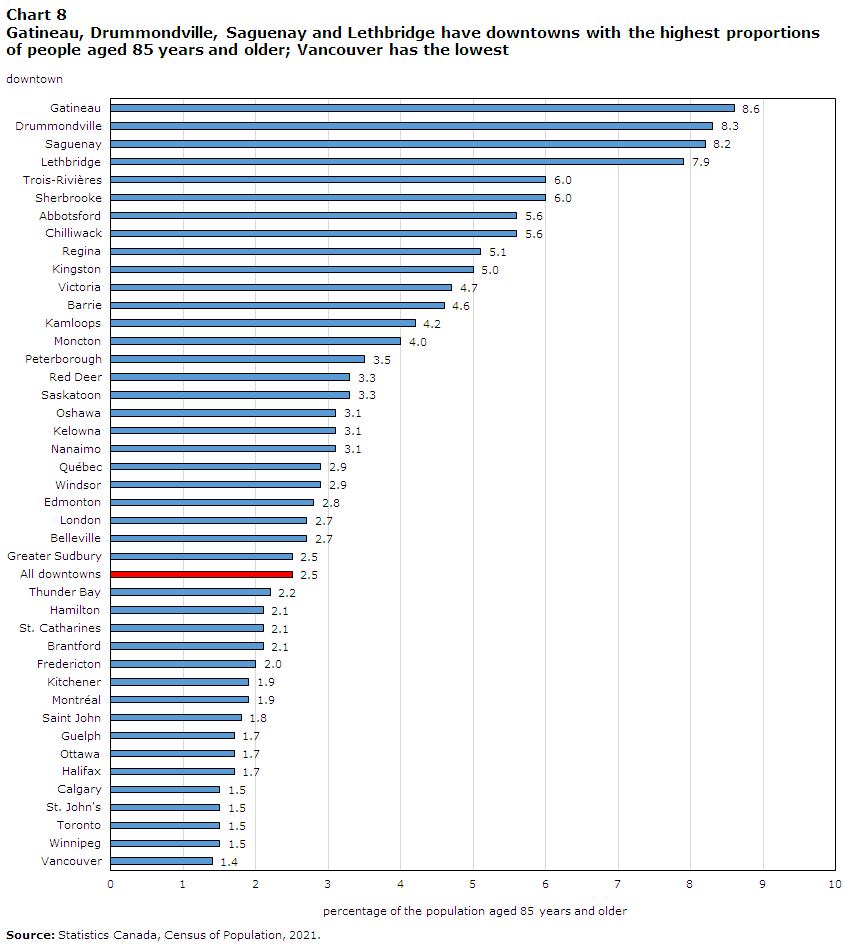
Downtowns are home to many older Canadians
Downtown areas of large cities often have more services and amenities, such as collective dwellings, health care, public transit and local commerce. Given access to such services, downtown areas may also attract many older seniors. Nationally, 2.5% of the population living in the downtowns of large urban centres are aged 85 and older compared with 2.3% for large urban centres overall (both downtowns and suburbs).
Start of text box 1
Did you know?
A census metropolitan area (CMA) is a large urban centre with 100,000 or more people.
Downtowns are located in the central core of a CMA and all other areas can be characterized by their distance from the downtown.
Downtowns are defined based on job density, and their boundaries are the subject of ongoing consultations with municipalities across the country, along with other experts and urban planners. For more information on the methods used to determine the boundaries of downtowns, see Defining Canada’s Downtown Neighbourhoods: 2016 Boundaries.
Every CMA has a primary downtown, located in the historic central municipality within the CMA. Thus, the downtown of the Toronto CMA is located within the municipality of Toronto.
Secondary downtowns have also been defined based on job density and on population counts in certain other municipalities within the CMA. For example, the municipality of Mississauga, which is part of the Toronto CMA, has a downtown that is referred to as secondary, given that the primary downtown for the Toronto CMA is in the central municipality of Toronto.
This analysis is limited to primary downtowns. The term “downtown” is used to refer to the primary downtowns of the CMAs.
End of text box 1
Some downtowns had a higher proportion of seniors than others, particularly mid-size or smaller cities. In the downtowns of Gatineau, Drummondville, and Saguenay in Quebec and Lethbridge in Alberta, around 8% of the population was in the 85-and-older group. When accounting for all areas of these large urban centres (downtowns and suburbs), less than 3% of the population was in this age group.
The downtowns of Trois-Rivières, Sherbrooke, Chilliwack, Abbotsford, Regina and Kingston also had a high proportion of older seniors, of at least 5%.
However, five of Canada’s largest urban centres (Toronto, Montréal, Vancouver, Ottawa and Calgary) were among the cities with the lowest proportion of people aged 85 and older living downtown. The downtown area with the lowest proportion of people in this age group was Vancouver, at 1.4%. These larger cities tend to have business districts and universities in their downtown cores, which typically attract younger populations. For more information on the different generations living in downtown areas, see the Census in Brief article entitled “A generational portrait of Canada’s aging population from the 2021 Census.”
Downtowns with higher proportions or larger numbers of older seniors may need to consider their service offerings differently to reflect an increased demand for accessible housing and health care services. These results highlight the importance of incorporating the changing demographic profile of Canada into urban planning.
Data table for Chart 8
| Downtown | Proportion |
|---|---|
| percentage of the population aged 85 years and older | |
| Gatineau | 8.6 |
| Drummondville | 8.3 |
| Saguenay | 8.2 |
| Lethbridge | 7.9 |
| Sherbrooke | 6.0 |
| Trois-Rivières | 6.0 |
| Chilliwack | 5.6 |
| Abbotsford | 5.6 |
| Regina | 5.1 |
| Kingston | 5.0 |
| Victoria | 4.7 |
| Barrie | 4.6 |
| Kamloops | 4.2 |
| Moncton | 4.0 |
| Peterborough | 3.5 |
| Saskatoon | 3.3 |
| Red Deer | 3.3 |
| Nanaimo | 3.1 |
| Kelowna | 3.1 |
| Oshawa | 3.1 |
| Windsor | 2.9 |
| Québec | 2.9 |
| Edmonton | 2.8 |
| Belleville | 2.7 |
| London | 2.7 |
| All downtowns | 2.5 |
| Greater Sudbury | 2.5 |
| Thunder Bay | 2.2 |
| Brantford | 2.1 |
| St. Catharines | 2.1 |
| Hamilton | 2.1 |
| Fredericton | 2.0 |
| Montréal | 1.9 |
| Kitchener | 1.9 |
| Saint John | 1.8 |
| Halifax | 1.7 |
| Ottawa | 1.7 |
| Guelph | 1.7 |
| Winnipeg | 1.5 |
| Toronto | 1.5 |
| St. John's | 1.5 |
| Calgary | 1.5 |
| Vancouver | 1.4 |
| Source: Statistics Canada, Census of Population, 2021. | |
The municipalities with the largest proportions of people aged 85 and older are in British Columbia and Quebec
Of the 737 municipalities with at least 5,000 people, 34 had more than 5% of their population in the 85-and-older age group.
People aged 85 and older make up more than 9% of the population in three municipalities in British Columbia, on southern Vancouver Island: Sidney, Duncan and Qualicum Beach. These places are known for their temperate climates, which can be a draw for people in their retirement years. They also have high proportions of people aged 65 and older.
| Rank of Municipality (Census Subdivision) in Province or Territory | Total Population | Population 85 Years and Older | Proportion of the Population Aged 85 and Older | Rank in Canada (out of 737) |
|---|---|---|---|---|
| number | percent | rank | ||
| Newfoundland and Labrador | ||||
| 1. Corner Brook | 19,330 | 610 | 3.2 | 185 |
| 2. Clarenville | 6,705 | 210 | 3.1 | 191 |
| 3. Gander | 11,880 | 365 | 3.1 | 195 |
| 4. Stephenville | 6,540 | 185 | 2.8 | 246 |
| 5. Grand Falls-Windsor | 13,855 | 330 | 2.4 | 348 |
| Prince Edward Island | ||||
| 1. Summerside | 16,000 | 530 | 3.3 | 162 |
| 2. Charlottetown | 38,810 | 1,220 | 3.1 | 187 |
| 3. Three Rivers | 7,880 | 185 | 2.3 | 358 |
| 4. Stratford | 10,930 | 170 | 1.6 | 527 |
| 5. Cornwall | 6,570 | 80 | 1.2 | 607 |
| Nova Scotia | ||||
| 1. Bridgewater | 8,790 | 430 | 4.9 | 38 |
| 2. Truro | 12,955 | 625 | 4.8 | 41 |
| 3. Kentville | 6,630 | 300 | 4.5 | 51 |
| 4. Yarmouth | 6,830 | 300 | 4.4 | 63 |
| 5. Wolfville | 5,055 | 210 | 4.2 | 75 |
| New Brunswick | ||||
| 1. Shediac | 7,535 | 350 | 4.6 | 49 |
| 2. Edmundston | 16,435 | 760 | 4.6 | 50 |
| 3. Bathurst | 12,155 | 545 | 4.5 | 53 |
| 4. Campbellton | 7,045 | 290 | 4.1 | 80 |
| 5. Woodstock | 5,555 | 220 | 4.0 | 91 |
| Quebec | ||||
| 1. Saint-Charles-Borromée | 15,285 | 1,220 | 8.0 | 4 |
| 2. Pointe-Claire | 33,485 | 2,490 | 7.4 | 5 |
| 3. Nicolet | 8,620 | 585 | 6.8 | 7 |
| 4. Louiseville | 7,340 | 490 | 6.7 | 9 |
| 5. Lac-Mégantic | 5,745 | 370 | 6.4 | 12 |
| Ontario | ||||
| 1. Perth | 6,465 | 475 | 7.3 | 6 |
| 2. Parry Sound | 6,880 | 465 | 6.8 | 8 |
| 3. Renfrew | 8,190 | 465 | 5.7 | 18 |
| 4. Cobourg | 20,520 | 1,140 | 5.6 | 19 |
| 5. Owen Sound | 21,610 | 1,135 | 5.3 | 24 |
| Manitoba | ||||
| 1. Dauphin | 8,365 | 370 | 4.4 | 58 |
| 2. Selkirk | 10,505 | 455 | 4.3 | 69 |
| 3. Neepawa | 5,685 | 225 | 4.0 | 92 |
| 4. Gimli | 6,570 | 240 | 3.7 | 117 |
| 5. Stonewall | 5,045 | 170 | 3.4 | 156 |
| Saskatchewan | ||||
| 1. Humboldt | 6,035 | 310 | 5.1 | 28 |
| 2. Melfort | 5,955 | 305 | 5.1 | 29 |
| 3. Weyburn | 11,020 | 555 | 5.0 | 33 |
| 4. Swift Current | 16,750 | 755 | 4.5 | 52 |
| 5. Yorkton | 16,280 | 675 | 4.1 | 77 |
| Alberta | ||||
| 1. Vegreville | 5,690 | 265 | 4.7 | 47 |
| 2. Stettler | 5,695 | 265 | 4.7 | 48 |
| 3. Innisfail | 7,985 | 335 | 4.2 | 74 |
| 4. Camrose | 18,770 | 770 | 4.1 | 82 |
| 5. Olds | 9,205 | 355 | 3.9 | 96 |
| British Columbia | ||||
| 1. Sidney | 12,320 | 1,150 | 9.3 | 1 |
| 2. Duncan | 5,045 | 470 | 9.3 | 2 |
| 3. Qualicum Beach | 9,305 | 865 | 9.3 | 3 |
| 4. Osoyoos | 5,555 | 365 | 6.6 | 10 |
| 5. White Rock | 21,940 | 1,435 | 6.5 | 11 |
| Yukon | ||||
| 1. Whitehorse | 28,205 | 290 | 1.0 | 640 |
| Northwest Territories | ||||
| 1. Yellowknife | 20,340 | 105 | 0.5 | 720 |
| Nunavut | ||||
| 1. Iqaluit | 7,430 | 0 | 0.0 | 737 |
|
Note: Yukon, the Northwest Territories, and Nunavut each only have one census subdivision with more than 5,000 residents. Due to random rounding, the numbers, percentages, and rankings in this table may not correspond to other data products. Source: Statistics Canada, Census of Population, 2021. |
||||
Looking ahead: A portrait of the lives of older Canadians
In the coming months, releases from the Census of Population will provide a more comprehensive socio-demographic portrait of the oldest Canadians. What challenges do older Canadians face in accessing housing? How many older women are living alone? How much income do people aged 85 and older have in retirement? Data from upcoming census releases will help to shed light on these and other issues.
In addition, the Demographic Estimates Program will continue to monitor demographic trends between censuses.
Additional information
Additional analysis on age, gender, and type of dwellings can be found in the Daily article entitled “In the midst of high job vacancies and historically low unemployment, Canada faces record retirements from an aging labour force: number of seniors aged 65 and older grows six times faster than children 0-14” and in the Census in Brief article entitled “A generational portrait of Canada’s aging population from the 2021 Census.” Catalogue no. 98-200-X.
Additional information on age, gender and type of dwellings can be found in the Data Tables; the Census Profile, Catalogue no. 98-316-X; and the Focus on Geography Series, Catalogue no. 98-404-X.
Thematic maps are also available for various levels of geography.
For details on the concepts, definitions and variables used in the 2021 Census of Population, please consult the Dictionary, Census of Population, 2021, Catalogue no. 98-301-X.
In addition to response rates and other data quality information, the Guide to the Census of Population, Catalogue no. 98-304-X, provides an overview of the various phases of the census, including content determination, sampling design, collection, data processing, data quality assessment, confidentiality guidelines and dissemination.
Acknowledgements
This report was prepared by Stacey Hallman, Sandrine LeVasseur, Julien Bérard-Chagnon and Laurent Martel of Statistics Canada’s Centre for Demography, with the assistance of other staff members in that centre and the collaboration of staff members of the Census Subject Matter Secretariat, Census Operations Division, Communications Branch and Data Access and Dissemination Branch.
- Date modified: