
Changes in income across different levels of educational attainment during the first year of the COVID-19 pandemic
Skip to text
Text begins
Highlights
- On average, people with a bachelor’s degree or higher experienced increases in employment income from 2019 to 2020, the first year of the COVID-19 pandemic, while those with education below the bachelor level experienced decreases during this period.
- On average, increases in government earning replacement benefits—the Canada Emergency Response Benefit (CERB) and related benefits, and Employment Insurance (EI)—more than offset decreases in employment income for all groups, except men with an apprenticeship certificate.
- By contrast with other provinces, on average, people in Alberta and in Newfoundland and Labrador with a bachelor’s degree or higher experienced decreases in employment income.
End of text box
Introduction
Job losses associated with the pandemic particularly affected people in certain industries that typically have lower earnings, such as accommodation and food services and administrative and support services.Note 1 This raised concerns about whether the pandemic worsened existing income disparities in Canada. Analyses of income data showed that, while lower-income populations experienced larger employment income losses, these were offset by COVID-19 economic and recovery benefits and EI. This resulted in an overall reduction in income inequality in 2020 compared with 2019.Note 2
A related question is whether the pandemic widened disparities between people with different levels of education. In general, higher levels of education are associated with higher earnings.Note 3 Additionally, education level was associated with job security during the pandemic. The Labour Force Survey showed that declines in the employment rate from February to April 2020, during the first months of the pandemic, were larger among those aged 25 to 64 with education below the bachelor level (11.7 percentage points), compared with those in the same age group who held a bachelor’s degree or higher (6.9 percentage points). The employment rates of those with education below the bachelor level did not recover to pre-pandemic levels until fall 2021, compared with late 2020 for those who held a bachelor’s degree or higher.Note 4
These disparities are connected to differences in the types of jobs held by people with different levels of education. People with higher incomes and those with a bachelor’s degree or higher are more likely to work in industries with high telework capacity, such as professional, scientific and technical services, that recovered rapidly from the pandemic.Note 5 They are also more likely to work in “triple-protected” jobs—those that are permanent rather than term or casual positions; cannot easily be automated; and are pandemic resilient because they are suitable for remote work, compatible with physical distancing or deemed essential by authorities.Note 6 By contrast, people with education below the bachelor level are more likely to work in sectors such as construction, retail trade, transportation and warehousing, and accommodation and food services. These sectors are more dependent on in-person work and therefore more affected by shutdowns and other policies such as physical distancing rules.Note 7
The goal of this article is to build on the previous census findings about the effects of the pandemic on income equality by examining changes in income by detailed level of education and gender. It examines three types of income: employment income; earning replacement benefits (namely, COVID-19 economic and recovery benefits and EI); and the combination of those two income types, referred to as labour market related income. It will provide a clearer understanding of the changes in employment income for people with different levels of education and the degree to which government benefits compensated for employment income losses. The 2021 Census data also provide other information, such as people’s major field of study and province of residence, as well as whether they live in an urban centre. This can shed further light on the relationship between education and income during the first year of the pandemic.
The target population for this article is people who were aged 25 to 64 at the time of the census in May 2021 and who had non-zero employment incomeNote 8 in either 2019 or 2020. People who had employment income in 2019 but none in 2020 (or, more rarely, vice versa) are therefore included, as declines in income experienced by those who went from having some employment income before the pandemic to having none in 2020 are an important part of the income picture. Income figures for 2019 are adjusted for inflation and presented in 2020 constant dollars. Education data and all other non-income variables are based on a person’s circumstances in May 2021; thus, for a small proportion of the population who completed their credentials between 2019 and May 2021, their level of education in May 2021 will not describe their level of education in 2019. This is not expected to influence the overall patterns observed in the data.
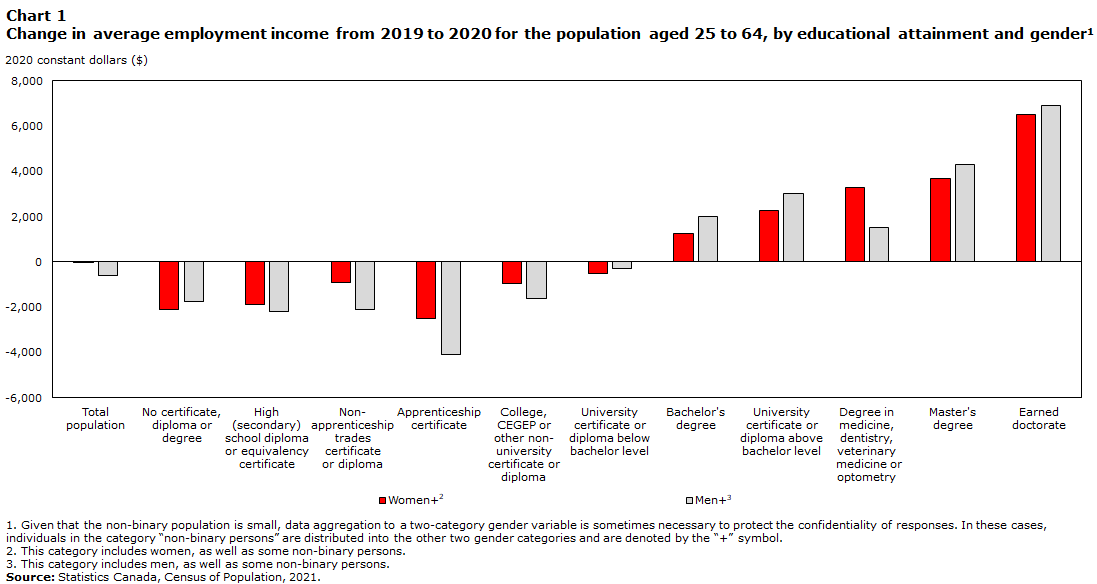
From 2019 to 2020, employment income increased for those with a bachelor’s degree or higher, but decreased for those below that level of education
The effects of the pandemic on Canadians’ employment incomes had significant variations across different levels of education. On average, people with educational attainment below a bachelor’s degree experienced decreases in their average employment income, whereas those with a bachelor’s degree or higher saw increases. The pattern was consistent across women and men (Chart 1).Note 9
Data table for Chart 1
| Highest certificate, diploma or degree | Change in average employment income from 2019 to 2020 | |
|---|---|---|
| Women+Data table for chart 1 Note 1 | Men+Data table for chart 1 Note 2 | |
| 2020 constant dollars | ||
| Total population | -40 | -600 |
| No certificate, diploma or degree | -2,120 | -1,760 |
| High (secondary) school diploma or equivalency certificate | -1,880 | -2,170 |
| Non-apprenticeship trades certificate or diploma | -920 | -2,100 |
| Apprenticeship certificate | -2,520 | -4,100 |
| College, CEGEP or other non-university certificate or diploma | -960 | -1,600 |
| University certificate or diploma below bachelor level | -520 | -300 |
| Bachelor's degree | 1,250 | 2,000 |
| University certificate or diploma above bachelor level | 2,250 | 3,000 |
| Degree in medicine, dentistry, veterinary medicine or optometry | 3,300 | 1,500 |
| Master's degree | 3,700 | 4,300 |
| Earned doctorate | 6,500 | 6,900 |
Source: Statistics Canada, Census of Population, 2021. |
||
In general, people with the lowest levels of education had larger decreases in employment income, and those with the highest levels of education had the largest increases. For example, people with no certificate, diploma or degree or with high school as their highest level of education experienced larger declines in employment income than those with a college credential or with a university certificate or diploma below the bachelor level. At the other end of the scale, the largest increases in employment income were among people with an earned doctorate, at $6,500 (+8.1%) for women and $6,900 (+6.6%) for men.
However, the change in average employment income is an aggregate figure. At every level of education, some people experienced decreases in employment income, while others experienced increases. People with lower levels of education were more likely to experience decreases, accounting for much of the difference in the average employment income change between educational groups. Employment income decreased for over half of people whose highest level of education was no certificate, diploma or degree (56.1%) or a high school diploma or equivalency certificate (52.8%); nearly half (49.0%) of those with a college certificate or diploma; over two in five (42.2%) of those with a bachelor’s degree; and over one-third (35.1%) of those with an earned doctorate.
This is a strong indicator of the connection between educational attainment and job security during the pandemic, which is at least partly because people with higher levels of education were more able to work remotely. In May 2021, over half (52.9%) of workers aged 25 to 64 with an earned doctorate were working from home,Note 10 compared with 39.4% of those with a bachelor’s degree; 22.7% of those with a college certificate or diploma; 15.5% of those with high school as their highest level of education; and 8.8% of those with no certificate, diploma or degree.
The largest decreases in average employment income, however, were among people with an apprenticeship certificate (Chart 1). Larger shares of men and women with an apprenticeship certificate experienced employment income decreases (57.2% of women and 56.0% of men) than was the case at any other level of education. This is likely because their jobs could rarely be done remotely; only 7.5% of people with an apprenticeship certificate were working from home in May 2021, a smaller proportion than for any other level of education. Further, among men with an apprenticeship certificate who experienced a decrease, the average decline was $17,800, larger than for any other group with education below the bachelor level. The magnitude of the decrease is likely attributable to the high pre-pandemic average earnings of men with an apprenticeship certificate ($69,700), which were higher than for any other group of men or women with education below the bachelor level. A person with high wages who is out of work for a month will lose more than someone with low wages who is off work for the same amount of time.
Among those with a degree in medicine, dentistry, veterinary medicine or optometry, experiences varied widely. Close to half of men (48.3%) and women (46.8%) with this level of education experienced declines in employment income, a larger share than for any other group with a bachelor’s degree or higher, as dentists’ and optometrists’ offices closed during parts of the pandemic, and some surgeries were cancelled. Conversely, the other half experienced increases in employment income, possibly attributable to high demand for doctors during the pandemic and/or to working overtime. Among those who experienced decreases in employment income, the drops were particularly large (-$35,600 for men and -$26,800 for women). Among those who experienced increases, the rises were similarly large (+$36,000 for men and +$29,700 for women). In both cases, the changes were larger than for people at any other education level.
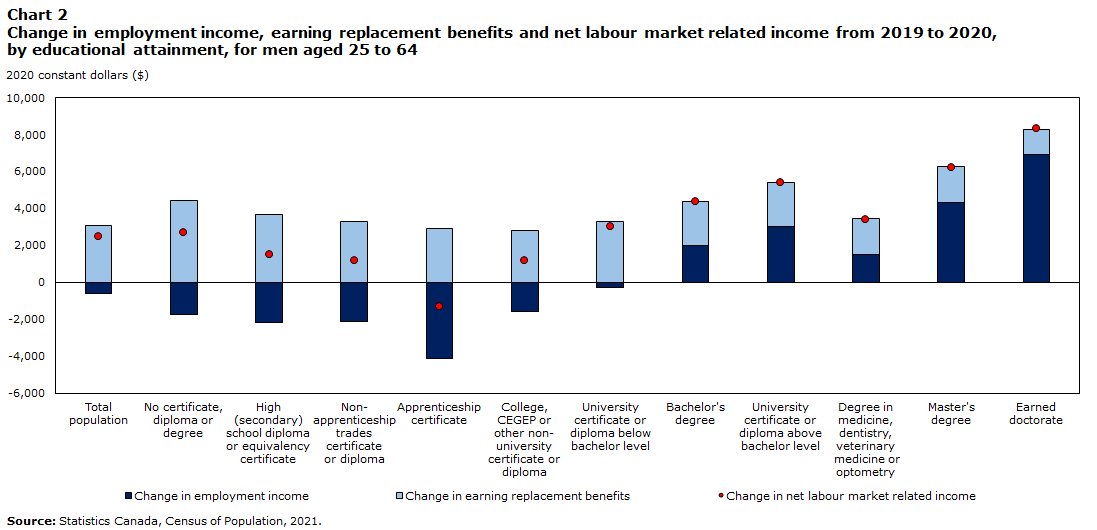
Increases in earning replacement benefits largely offset employment income declines for people with education below the bachelor level
At the onset of the pandemic, in response to shutdowns and job losses, the government provided income support through a number of response and recovery benefits, such as the CERB and the Canada Emergency Student Benefit (CESB). The combination of federal COVID-19 emergency and recovery benefitsNote 11 in 2020 and EI in 2019 and 2020 is herein referred to as earning replacement benefits. The combination of income from these benefits and from employment income is referred to as net labour market related income.
Average increases in earning replacement benefits from 2019 to 2020 were larger among people with lower levels of education (charts 2 and 3). This was because those with lower levels of education, as mentioned previously, were more likely to experience decreases in employment income, and the benefits were directed at offsetting these decreases. The differences by education level in the average increases in earning replacement benefits from 2019 to 2020 were primarily attributable to the share of people at each level of education who received increased earning replacement benefits. The proportion of people who received more earning replacement benefits in 2020 than in 2019 ranged from roughly half (50.4%) of those with no certificate, diploma or degree to 28.6% of those with a bachelor’s degree and 17.5% of those with an earned doctorate. This trend existed for both women and men. Women with an apprenticeship certificate—many of whom had certificates in fields adversely affected by the pandemic, such as hairdressing or culinary services—were the most likely to experience an increase in earning replacement benefits (56.1%), whereas 41.8% of men with an apprenticeship certificate did.
Data table for Chart 2
| Highest certificate, diploma or degree | Change in employment income | Change in earning replacement benefits | Change in net labour market related income |
|---|---|---|---|
| 2020 constant dollars | |||
| Total population | -600 | 3,055 | 2,500 |
| No certificate, diploma or degree | -1,760 | 4,449 | 2,680 |
| High (secondary) school diploma or equivalency certificate | -2,170 | 3,692 | 1,500 |
| Non-apprenticeship trades certificate or diploma | -2,100 | 3,295 | 1,200 |
| Apprenticeship certificate | -4,100 | 2,892 | -1,300 |
| College, CEGEP or other non-university certificate or diploma | -1,600 | 2,813 | 1,200 |
| University certificate or diploma below bachelor level | -300 | 3,283 | 3,000 |
| Bachelor's degree | 2,000 | 2,364 | 4,400 |
| University certificate or diploma above bachelor level | 3,000 | 2,400 | 5,400 |
| Degree in medicine, dentistry, veterinary medicine or optometry | 1,500 | 1,974 | 3,400 |
| Master's degree | 4,300 | 1,968 | 6,200 |
| Earned doctorate | 6,900 | 1,359 | 8,300 |
| Source: Statistics Canada, Census of Population, 2021. | |||

Data table for Chart 3
| Highest certificate, diploma or degree | Change in employment income | Change in earning replacement benefits | Change in net labour market related income |
|---|---|---|---|
| 2020 constant dollars | |||
| Total population | -40 | 3,400 | 3,320 |
| No certificate, diploma or degree | -2,120 | 5,570 | 3,480 |
| High (secondary) school diploma or equivalency certificate | -1,880 | 4,282 | 2,440 |
| Non-apprenticeship trades certificate or diploma | -920 | 4,249 | 3,360 |
| Apprenticeship certificate | -2,520 | 5,332 | 2,840 |
| College, CEGEP or other non-university certificate or diploma | -960 | 3,458 | 2,480 |
| University certificate or diploma below bachelor level | -520 | 3,490 | 3,000 |
| Bachelor's degree | 1,250 | 2,506 | 3,750 |
| University certificate or diploma above bachelor level | 2,250 | 2,279 | 4,500 |
| Degree in medicine, dentistry, veterinary medicine or optometry | 3,300 | 2,228 | 5,600 |
| Master's degree | 3,700 | 2,051 | 5,800 |
| Earned doctorate | 6,500 | 1,380 | 7,900 |
| Source: Statistics Canada, Census of Population, 2021. | |||
Consistent with the findings of the 2021 Census release on income, on average, earning replacement benefits offset decreases in employment income from 2019 to 2020. Among people with education below the bachelor level, average increases in earning replacement benefits were larger than average decreases in employment income, resulting in an average increase in net labour market related income. The only exception to this finding was men with an apprenticeship certificate, for two reasons. First, as noted above, a large share of them experienced declines in employment income (56.0%); they typically worked in jobs that could not be done remotely. Second, the size of the benefit increases among those who received increased earning replacement benefits (+$7,884) was smaller than the size of employment income losses among those whose employment income decreased (-$17,800).
People with a bachelor’s degree or higher experienced average increases in both income types, and thus had, on average, larger increases in net labour market related income than those with lower levels of education. However, in most cases, the people who received increases in earning replacement benefits were not the same as those who had increases in employment income. Fewer than 10% of those with a bachelor’s degree saw an increase in both income types (compared with, for example, 13.6% of those with no certificate, diploma or degree), while 22.5% of them had a decrease in employment income but did not have an increase in earning replacement benefits.
Having a degree in mathematics, computer and information sciences was associated with large increases in employment income, while men with a credential in trades fields had the largest decreases
Changes in employment income from 2019 to 2020 also varied notably by major field of study. The largest increases were among men (+$7,900, or +9.4%) and women (+$4,600, or +7.9%) with a bachelor’s degree or higher in mathematics, computer and information sciences. Men with a postsecondary credential below the bachelor level in mathematics, computer and information sciences also had an increase in employment income (+$1,200, or +1.8%), unlike most other people at that level of education. Remote work may have been more feasible, and thus job losses less common and briefer, for people who worked in these areas. In the professional, scientific and technical services sector, which includes computer systems design and related services, telework capacity was over 80%,Note 12 and employment in January 2021 was higher than it had been before the pandemic.Note 13
At the other end of the scale, men with a postsecondary credential below the bachelor level in architecture, engineering and related trades experienced the largest employment income decreases (in dollar terms) for any major field of study (-$3,200, or -4.7%). At the below-bachelor level, this field is often connected to jobs in the trades. Among men with a postsecondary credential below the bachelor level in this field who worked in 2020 or 2021, nearly 6 in 10 (59.1%) worked in the occupational category of trades, transport and equipment operators and related occupations. This occupational category saw a 6.9% decrease in employment for men from 2019 to 2020, larger than the 5.0% decline among men employed across all sectors.Note 14 Among men aged 25 to 64 with an apprenticeship certificate specifically, a large majority (87.2%) studied architecture, engineering and related tradesNote 15 , so job losses in the trades also help to explain their declines in employment income.
Percentage decreases in employment income for men with a postsecondary credential below the bachelor level were similarly large for those whose major field of study was personal, protective and transportation services (-4.7%, or -$2,900) or visual and performing arts and communications technologies (-4.7%, or -$2,360). However, they were smaller in dollar terms because people in these fields typically have lower earnings. These two fields also had the largest percentage and dollar decreases in employment income for women with a postsecondary credential below the bachelor level: down 8.6%, or $2,800, in personal, protective and transportation services, and down 6.5%, or $2,440, in visual and performing arts and communications technologies. This was because hairdressing, culinary services such as restaurants, and performing arts were especially affected by the pandemic—they involve a high degree of in-person contact.
Employment income decreases were larger and more widespread across education levels in Alberta and Newfoundland and Labrador
While in most provinces the patterns of changes in employment income by level of education were similar to the national pattern, there were some exceptions, especially in Alberta and Newfoundland and Labrador. Previous 2021 Census analyses found that these were the only two provinces where median household income declined from 2015 to 2020, connected not only with the pandemic but with lower oil prices during that period. Both provinces are substantial oil producers, and oil prices fell to record lows during 2020 as much of global and national travel and transport was restricted because of the pandemic.Note 16
From 2019 to 2020, the average employment income of people with a bachelor’s degree or higher declined in Alberta (-$2,100, or -2.1%, for men and -$900, or -1.4%, for women) and in Newfoundland and Labrador (-$900, or -1.0%, for men and -$800, or -1.2%, for women), in contrast to the increases seen nationally and in all other provinces for people with this level of education. In Alberta, men at every level of education, including those with a master’s degree or doctorate, experienced employment income decreases, and the declines were broad-based across most fields of study. This was likely connected with provincewide economic challenges connected to the pandemic’s impacts on the oil sector. In Newfoundland and Labrador, however, employment income declines for degree-holders were primarily attributable to large decreases in employment income (over $10,000, and 15% to 17%, among both women and men) among those with a degree in education, as elementary and secondary school teachers in this province experienced large earnings decreases. These declines were not attributable to periods of being off work, as they were seen among education degree holders who worked for the full year in 2020.
In addition, employment income decreases of men with an apprenticeship certificate in these two provinces were larger than those seen for Canada overall. This likely plays a role in the large employment income decreases of men with an apprenticeship certificate at the national level: Alberta accounted for 11.7% of Canada’s population aged 25 to 64, but for 19.9% of the men with an apprenticeship certificate in this age group. While men with an apprenticeship certificate experienced average employment income declines of $4,100 (-5.9%) at the national level, decreases were larger in Newfoundland and Labrador (-$10,000, or -13.8%) and in Alberta (-$7,300, or -8.5%).
Moreover, federal government transfers in the form of earning replacement benefits (such as the CERB) did not offset employment income losses in these two provinces as much as in the other provinces. At most levels of education below a bachelor’s degree, men in Alberta and Newfoundland and Labrador still experienced losses after taking into account these benefits (i.e., experienced declines in net labour market related income). In Canada overall, this was only the case for men with an apprenticeship certificate. For Alberta in particular, this is in part because the main earning replacement benefit (the CERB) was set at a flat rate ($2,000 per month), and pre-pandemic earnings at every level of education were higher in Alberta than in Canada overall.
Declines in income were more widespread among men living outside urban centres, but the same was not the case for women
Experiences also differed somewhat between men living in large urban centres (census metropolitan areas), in smaller urban centres (census agglomerations) and outside urban centres. The changes in income by education level for men in large urban centres and for women in all three geographical categories were similar to those of people in Canada overall. However, outside urban centres, men with a bachelor’s degree or an earned doctorate had declines in average employment income. Moreover, in addition to the declines in labour market related income among men with an apprenticeship certificate, men outside urban centres with a college certificate or diploma, a university certificate or diploma below the bachelor level, or an earned doctorate also experienced declines in labour market related income. These findings may indicate that there were fewer options for remote work among people living outside urban centres.
Conclusion
This article’s analyses support and expand upon previous findings that people with lower levels of education were more likely to lose jobs and employment income during the COVID-19 pandemic. On average, people with levels of education below a bachelor’s degree had lower employment income in 2020 than in 2019, while those with a bachelor’s degree or higher saw increases in employment income. However, government benefits such as the CERB offset declines in employment income for all groups except men with an apprenticeship certificate.
Additional information
Additional analysis on changes in income during the COVID-19 pandemic can be found in the Census in Brief article “The contribution of pandemic relief benefits to the incomes of Canadians in 2020” and the Daily article “Pandemic benefits cushion losses for low income earners and narrow income inequality – after-tax income grows across Canada except in Alberta and Newfoundland and Labrador.”
Additional information on changes in income from 2019 to 2020 in relation to educational characteristics can be found in data tables.
Reference products are designed to help users make the most of 2021 Census data. These include the Education Reference Guide; the Income Reference Guide; the Guide to the Census of Population, 2021; the Dictionary, Census of Population, 2021; and the 2021 Census of Population questionnaires.
Data sources, methods and definitions
Data sources
The data in this analysis are from the 2021 Census of Population. Further information on the census can be found in the Guide to the Census of Population, 2021, Catalogue no. 98-304-X2021001.
All information on the quality and comparability of census data on education can be found in the Education Reference Guide, Census of Population, 2021, Catalogue no. 98-500-X2021013.
Methods
The target population of this study is people aged 25 to 64 in private households who had non-zero employment income in either 2019 or 2020.
Income figures for 2019 are adjusted for inflation and are presented in 2020 constant dollars.
Given that the non-binary population is small, data aggregation to a two-category gender variable is sometimes necessary to protect the confidentiality of responses. In these cases, individuals in the category “non-binary persons” are distributed into the other two gender categories. Unless otherwise indicated in the text, the category “men” includes men, as well as some non-binary persons, while the category “women” includes women, as well as some non-binary persons. For more information on the gender concept, see Filling the gaps: Information on gender in the 2021 Census.
Random rounding and percentage distributions: To ensure the confidentiality of responses collected for the 2021 Census, a random rounding process is used to alter the values reported in individual cells. As a result, when these data are summed or grouped, the total value may not match the sum of the individual values, since the total and subtotals are independently rounded. Similarly, percentage distributions, which are calculated on rounded data, may not add up to 100%.
Definitions
Employment income: This consists of all income received as wages, salaries and commissions from paid employment and net self-employment income from farm or non-farm unincorporated business or professional practice during the reference period.
Earning replacement benefits: This refers to Employment Insurance in 2019, and in 2020 to Employment Insurance as well as the following federal COVID-19 benefits: the Canada Emergency Response Benefit, Canada Emergency Student Benefit, Canada Recovery Benefit, Canada Recovery Caregiving Benefit and Canada Recovery Sickness Benefit.
Net labour market related income: This refers to employment income plus earning replacement benefits.
Bachelor’s degree or higher: This includes bachelor’s, master’s and doctoral degrees; degrees in medicine, dentistry, veterinary medicine and optometry; and university certificates and diplomas that have a bachelor’s degree as a prerequisite.
References
Frenette, Marc and René Morisette. 2021. “Job security in the age of artificial intelligence and potential pandemics.” Economic and Social Reports 1:6. June. Statistics Canada Catalogue no. 36-28-0001.
Meier, Rebecca, Tshibangu Batubenga and Daanish Garda. 2021. “Industrial Product Price Index: Annual Review, 2020.” Prices Analytical Series. February. Statistics Canada Catalogue no. 62F0014M.
Statistics Canada. 2017. “Does education pay? A comparison of earnings by level of education in Canada and its provinces and territories.” Census in Brief. November. Statistics Canada Catalogue no. 98‑200‑X2016023.
Statistics Canada. 2020a. “Labour Force Survey, April 2020.” The Daily. April. https://www150.statcan.gc.ca/n1/daily-quotidien/200508/dq200508a-eng.htm
Statistics Canada. 2020b. “Labour Force Survey, December 2020.” The Daily. December. https://www150.statcan.gc.ca/n1/daily-quotidien/210108/dq210108a-eng.htm
Statistics Canada. 2021a. COVID-19 in Canada: A One-year Update on Social and Economic Impacts. March. Statistics Canada Catalogue no. 11-631-X.
Statistics Canada. 2021b. COVID-19 in Canada: Year-end Update on Social and Economic Impacts. December. Statistics Canada Catalogue no. 11-631-X.
Statistics Canada. 2021c. “Labour Force Survey, January 2021.” The Daily. January. https://www150.statcan.gc.ca/n1/daily-quotidien/210205/dq210205a-eng.htm
Statistics Canada. 2021d. “Working from home during the COVID-19 pandemic, April 2020 to June 2021.” The Daily. August. https://www150.statcan.gc.ca/n1/daily-quotidien/210804/dq210804b-eng.htm
Statistics Canada. 2022. “Pandemic benefits cushion losses for low income earners and narrow income inequality – after-tax income grows across Canada except in Alberta and Newfoundland and Labrador.” The Daily. July. https://www150.statcan.gc.ca/n1/daily-quotidien/220713/dq220713d-eng.htm
- Date modified: