
Core housing need, 2016 Census
Release date: November 15, 2017
Statistics Canada, in collaboration with the Canada Mortgage and Housing Corporation (CMHC), has produced the CMHC’s core housing need indicator for the 2016 Census. This variable is now available for custom tabulations with other census long-form characteristics.
A household in core housing need is one whose dwelling is considered unsuitable, inadequate or unaffordable and whose income levels are such that they could not afford alternative suitable and adequate housing in their community.
Table 1 presents the number of households considered in core need and the core need rate for the provinces and territories.
| Blank cell | Number of households in core housing need | Core housing need rate (%) | ||||
|---|---|---|---|---|---|---|
| 2006 | 2011 | 2016 | 2006 | 2011 | 2016 | |
| Canada | 1,494,395 | 1,552,060 | 1,693,775 | 12.7 | 12.5 | 12.7 |
| Newfoundland and Labrador | 27,310 | 22,945 | 22,495 | 14.2 | 11.4 | 10.5 |
| Prince Edward Island | 6,430 | 4,945 | 4,875 | 12.6 | 9.2 | 8.5 |
| Nova Scotia | 43,760 | 46,285 | 49,450 | 12.1 | 12.5 | 12.8 |
| New Brunswick | 29,360 | 29,570 | 27,715 | 10.3 | 9.9 | 9.0 |
| Quebec | 324,590 | 348,485 | 305,590 | 10.6 | 10.8 | 9.0 |
| Ontario | 627,530 | 616,930 | 748,310 | 14.5 | 13.4 | 15.3 |
| Manitoba | 46,920 | 43,405 | 51,130 | 11.3 | 10.3 | 11.4 |
| Saskatchewan | 40,835 | 47,240 | 51,755 | 11.8 | 13.2 | 13.4 |
| Alberta | 119,050 | 137,485 | 164,275 | 10.1 | 10.7 | 11.4 |
| British Columbia | 221,470 | 247,285 | 260,220 | 14.6 | 15.4 | 14.9 |
| Yukon | 1,875 | 1,915 | 2,160 | 16.3 | 14.7 | 15.2 |
| Northwest Territories | 2,390 | 2,215 | 2,255 | 17.5 | 15.7 | 15.5 |
| Nunavut | 2,870 | 3,355 | 3,545 | 37.3 | 39.3 | 36.5 |
|
Note: Only private, non-farm, non-reserve and owner- or renter-households with incomes greater than zero and shelter-cost-to-income ratios less than 100% are assessed for 'core housing need.' Non-family households with at least one maintainer aged 15 to 29 attending school are considered not to be in 'Core housing need' regardless of their housing circumstances. Attending school is considered a transitional phase, and low incomes earned by student households are viewed as being a temporary condition. Sources: Statistics Canada, Census of population, 2006 and 2016 and National Household Survey, 2011. |
||||||
Figure 1 presents the core housing need prevalence rates for all census metropolitan areas.
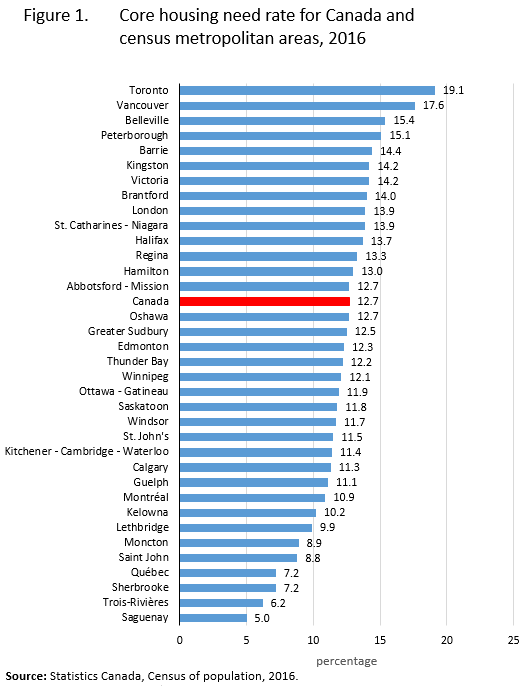
Description of Figure 1
This horizontal bar chart shows the percentage of households in core housing need for census metropolitan areas, 2016.
The Y axis shows the census metropolitan areas in decreasing order of their rate value.
The X axis shows the core housing need rate in percentage.
The national rate is identified in red.
| Census metropolitan area (CMA) | Core housing need rate (%) |
|---|---|
| Toronto | 19.1 |
| Vancouver | 17.6 |
| Belleville | 15.4 |
| Peterborough | 15.1 |
| Barrie | 14.4 |
| Victoria | 14.2 |
| Kingston | 14.2 |
| Brantford | 14.0 |
| St. Catharines - Niagara | 13.9 |
| London | 13.9 |
| Halifax | 13.7 |
| Regina | 13.3 |
| Hamilton | 13.0 |
| Oshawa | 12.7 |
| Canada | 12.7 |
| Abbotsford - Mission | 12.7 |
| Greater Sudbury | 12.5 |
| Edmonton | 12.3 |
| Thunder Bay | 12.2 |
| Winnipeg | 12.1 |
| Ottawa - Gatineau | 11.9 |
| Saskatoon | 11.8 |
| Windsor | 11.7 |
| St. John's | 11.5 |
| Kitchener - Cambridge - Waterloo | 11.4 |
| Calgary | 11.3 |
| Guelph | 11.1 |
| Montréal | 10.9 |
| Kelowna | 10.2 |
| Lethbridge | 9.9 |
| Moncton | 8.9 |
| Saint John | 8.8 |
| Sherbrooke | 7.2 |
| Québec | 7.2 |
| Trois-Rivières | 6.2 |
| Saguenay | 5.0 |
| Source: Statistics Canada, Census of population, 2016. | |
Some notes on the core housing need concept
Core housing need was derived in two stages. The first identified whether the household was living in a dwelling considered unsuitable, inadequate or unaffordable. Housing suitability identified whether the dwelling had enough bedrooms according to its size and composition. Housing adequacy was assessed based on the Dwelling condition not being reported in need of major repairs. A shelter-cost-to-income ratio of less than 30% was required to deem the housing affordable. The second stage established whether the household could be expected to have affordable access to suitable and adequate alternative housing by comparing the household’s total income to an income threshold based on local housing costs. Only those households who could not afford alternative housing would be considered in core housing need.
Table 2 presents, for households deemed to be in core housing need, how many and which of the three standards were not met. This information is further disaggregated by the two applicable tenure types.
| Blank cell | All households | Owner households | Renter households | |||
|---|---|---|---|---|---|---|
| Count | % | Count | % | Count | % | |
| Total – Households in core need | 1,693,775 | 100.0 | 573,865 | 100.0 | 1,119,915 | 100.0 |
| Below one standard | 1,435,820 | 84.8 | 505,240 | 88.0 | 930,570 | 83.1 |
| Below affordability only | 1,288,315 | 76.1 | 451,545 | 78.7 | 836,770 | 74.7 |
| Below suitability only | 72,095 | 4.3 | 12,140 | 2.1 | 59,955 | 5.4 |
| Below adequacy only | 75,410 | 4.5 | 41,555 | 7.2 | 33,845 | 3.0 |
| Below two standards | 245,540 | 14.5 | 66,790 | 11.6 | 178,760 | 16.0 |
| Below affordability and suitability | 104,910 | 6.2 | 21,380 | 3.7 | 83,540 | 7.5 |
| Below affordability and adequacy | 129,120 | 7.6 | 43,390 | 7.6 | 85,730 | 7.7 |
| Below suitability and adequacy | 11,510 | 0.7 | 2,020 | 0.4 | 9,490 | 0.8 |
| Below all three standards | 12,420 | 0.7 | 1,830 | 0.3 | 10,580 | 0.9 |
| Source: Statistics Canada, Census of population, 2016. | ||||||
More information on concepts is available in the Census dictionary.
Indicator tables similar to Table 1 for selected geographic levels are available for download in comma-separated-variable (CSV) format.
- Canada, provinces and territories (21 KB)
- Census metropolitan areas (CMA) and census agglomerations (CA) (57 KB)
- Census tracts (CT) for CMAs and tracted CAs (1,516 KB)
- Federal electoral districts (FED) (125 KB)
- Census divisions (CD) (98 KB)
- Census subdivisions (CSD) (1,044 KB)
Statistics Canada’s Census Program Data Viewer (CPDV) also maps the core housing need rate to all areas supported by the viewer as well as presenting charts determining core housing need status for all inadequate, unsuitable and unaffordable housing. Within the CPDV, select the 'I want to…' button, then click select an indicator, select the housing topic and then the indicators: inadequate core housing needs; unsuitable core housing needs; unaffordable core housing needs.
Further tables and breakdowns are possible across other census variables with custom tabulations.
CMHC has also produced a document on core housing need in the Housing Observer Online and will continue to release detailed data tables and analysis as they become available in the coming weeks and months.
- Date modified: