
Archived Content
Information identified as archived is provided for reference, research or recordkeeping purposes. It is not subject to the Government of Canada Web Standards and has not been altered or updated since it was archived. Please contact us to request a format other than those available.
Focus on Geography Series, 2011 Census
Province of Alberta 1

Map of Alberta
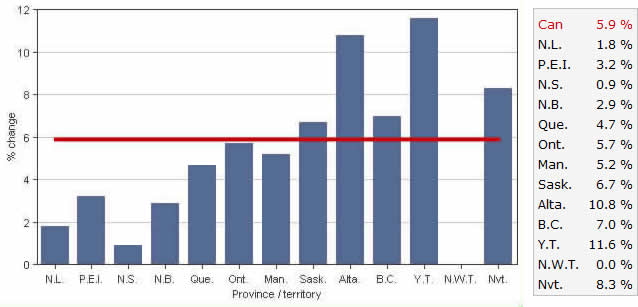
In 2011, the enumerated population of Alberta was 3,645,257 which represents a change of 10.8% from 2006. This compares to the national average of 5.9%.
The land area of Alberta is 640,081.87 square kilometres with a population density of 5.7 persons per square kilometre. This compares to the national land area of 8,965,121.42 square kilometres with a population density of 3.7 persons per square kilometre.
In total, there were 1,390,275 private dwellings occupied by usual residents in Alberta in 2011. This represents an increase of 10.7% of the number of private dwellings occupied by usual residents from 2006. For Canada as a whole, the total number of private dwellings occupied by usual residents increased 7.1%.
Population and dwelling counts
Canada, provinces and territories – Population, percentage change between 2006 and 2011
| Geographic name | Population | ||||
|---|---|---|---|---|---|
| 2011 | 2006 | Change | % change | % of nat. pop. | |
| Canada † | 33,476,688 | 31,612,897 | 1,863,791 | 5.9 | 100.00 |
| Newfoundland and Labrador | 514,536 | 505,469 | 9,067 | 1.8 | 1.54 |
| Prince Edward Island | 140,204 | 135,851 | 4,353 | 3.2 | 0.42 |
| Nova Scotia | 921,727 | 913,462 | 8,265 | 0.9 | 2.75 |
| New Brunswick | 751,171 | 729,997 | 21,174 | 2.9 | 2.24 |
| Quebec † | 7,903,001 | 7,546,131 | 356,870 | 4.7 | 23.61 |
| Ontario † | 12,851,821 | 12,160,282 | 691,539 | 5.7 | 38.39 |
| Manitoba † | 1,208,268 | 1,148,401 | 59,867 | 5.2 | 3.61 |
| Saskatchewan † | 1,033,381 | 968,157 | 65,224 | 6.7 | 3.09 |
| Alberta † | 3,645,257 | 3,290,350 | 354,907 | 10.8 | 10.89 |
| British Columbia † | 4,400,057 | 4,113,487 | 286,570 | 7.0 | 13.14 |
| Yukon | 33,897 | 30,372 | 3,525 | 11.6 | 0.10 |
| Northwest Territories | 41,462 | 41,464 | -2 | 0.0 | 0.12 |
| Nunavut | 31,906 | 29,474 | 2,432 | 8.3 | 0.10 |
Alberta – Census metropolitan areas (CMAs), census agglomerations (CAs) and regions outside CMAs and CAs
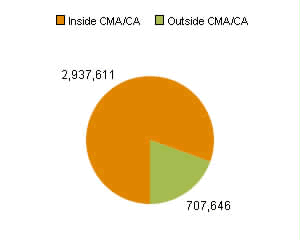
In 2011, 80.6% of the population of Alberta lived inside a census metropolitan area (CMA) or census agglomeration (CA). That represents 2,937,611 persons.
The number of persons living outside a census metropolitan area (CMA) and a census agglomeration (CA) was 707,646 which accounts for 19.4% of the provincial population.
| CMA or CA name | Type | Population | Rank | |||
|---|---|---|---|---|---|---|
| 2011 | 2006 | % change | Nat. | Prov. | ||
| Calgary | CMA | 1,214,839 | 1,079,310 | 12.6 | 5 | 1 |
| Edmonton | CMA | 1,159,869 | 1,034,945 | 12.1 | 6 | 2 |
| Lethbridge | CA | 105,999 | 95,196 | 11.3 | 34 | 3 |
| Red Deer | CA | 90,564 | 83,154 A | 8.9 | 43 | 4 |
| Medicine Hat | CA | 72,807 | 68,822 | 5.8 | 50 | 5 |
| Wood Buffalo | CA | 66,896 | 52,643 | 27.1 | 51 | 6 |
| Grande Prairie | CA | 55,032 | 47,107 A | 16.8 | 59 | 7 |
| Lloydminster | CA | 30,798 | 27,023 | 14.0 | 87 | ··· |
| Lloydminster (Saskatchewan part / partie de la Saskatchewan) | 12,766 | 11,113 | 14.9 | ··· | 9 | |
| Lloydminster (Alberta part / partie de l'Alberta) | 18,032 | 15,910 | 13.3 | ··· | 10 | |
| Okotoks | CA | 24,511 | 17,150 A | 42.9 | 101 | 8 |
| Brooks | CA | 23,430 | 22,452 | 4.4 | 103 | 9 |
| Camrose | CA | 17,286 | 15,630 A | 10.6 | 117 | 11 |
| Cold Lake | CA | 13,839 | 11,991 | 15.4 | 127 | 12 |
| High River | CA | 12,920 | 10,716 A | 20.6 | 134 | 13 |
| Sylvan Lake | CA | 12,762 | 10,703 A | 19.2 | 136 | 14 |
| Wetaskiwin | CA | 12,525 | 11,689 A | 7.2 | 138 | 15 |
| Strathmore | CA | 12,305 | 10,280 A | 19.7 | 140 | 16 |
| Canmore | CA | 12,288 | 12,039 | 2.1 | 141 | 17 |
| Lacombe | CA | 11,707 | 10,752 A | 8.9 | 144 | 18 |
Alberta – Census subdivisions, with 5,000-plus population with the highest population growth
| Census subdivision (CSD) name | CSD type | Population | ||
|---|---|---|---|---|
| 2011 | 2006 | % change | ||
| Chestermere | T | 14,824 | 9,923 A | 49.4 |
| Beaumont | T | 13,284 | 8,961 | 48.2 |
| Airdrie | CY | 42,564 | 28,927 | 47.1 |
| Leduc | CY | 24,279 | 16,967 | 43.1 |
| Okotoks | T | 24,511 | 17,150 A | 42.9 |
Alberta – Census subdivisions, with 5,000-plus population with the lowest population growth
| Census subdivision (CSD) name | CSD type | Population | ||
|---|---|---|---|---|
| 2011 | 2006 | % change | ||
| Lac la Biche County | MD | 8,402 | 9,123 A | -7.9 |
| Willow Creek No. 26 | MD | 5,107 | 5,337 | -4.3 |
| Crowsnest Pass | SM | 5,565 | 5,749 | -3.2 |
| Greenview No. 16 | MD | 5,299 | 5,464 | -3.0 |
| Lethbridge County | MD | 10,061 | 10,254 A | -1.9 |
| Stettler County No. 6 | MD | 5,089 | 5,189 A | -1.9 |
Age and sex
Alberta – Age distribution

| Age groups | Both sexes | Males | Females |
|---|---|---|---|
| 0 to 14 | 18.8% | 19.2% | 18.4% |
| 15 to 64 | 70.1% | 70.7% | 69.4% |
| 65 and over | 11.1% | 10.1% | 12.2% |
In 2011, the percentage of the population aged 65 and over in Alberta was 11.1%, compared with a national percentage of 14.8%. The percentage of the working age population (15 to 64) was 70.1% and the percentage of children aged 0 to 14 was 18.8%. In comparison, the national percentages were 68.5% for the population aged 15 to 64 and 16.7% for the population aged 0 to 14.
Alberta – Population by broad age groups and sex
| Broad age groups by sex | Population | |||
|---|---|---|---|---|
| 2011 | 2006 | change | % change | |
| Both sexes | ||||
| Total | 3,645,260 | 3,290,350 | 354,910 | 10.8 |
| 0 to 14 | 684,790 | 631,515 | 53,275 | 8.4 |
| 15 to 64 | 2,554,745 | 2,305,420 | 249,325 | 10.8 |
| 65 and over | 405,725 | 353,410 | 52,315 | 14.8 |
| Males | ||||
| Total | 1,827,810 | 1,646,795 | 181,015 | 11.0 |
| 0 to 14 | 351,085 | 323,600 | 27,485 | 8.5 |
| 15 to 64 | 1,292,610 | 1,164,670 | 127,940 | 11.0 |
| 65 and over | 184,125 | 158,535 | 25,590 | 16.1 |
| Females | ||||
| Total | 1,817,440 | 1,643,550 | 173,890 | 10.6 |
| 0 to 14 | 333,705 | 307,920 | 25,785 | 8.4 |
| 15 to 64 | 1,262,135 | 1,140,755 | 121,380 | 10.6 |
| 65 and over | 221,605 | 194,880 | 26,725 | 13.7 |
Alberta – Population by five-year age groups and sex

| Age groups | Both sexes | Males | Females |
|---|---|---|---|
| Total - Age groups | 3,645,260 | 1,827,810 | 1,817,440 |
| 0 to 4 years | 244,880 | 125,670 | 119,210 |
| 5 to 9 years | 218,995 | 112,010 | 106,990 |
| 10 to 14 years | 220,915 | 113,410 | 107,505 |
| 15 to 19 years | 238,205 | 122,060 | 116,140 |
| 20 to 24 years | 258,475 | 131,510 | 126,970 |
| 25 to 29 years | 288,735 | 146,330 | 142,405 |
| 30 to 34 years | 274,395 | 138,600 | 135,795 |
| 35 to 39 years | 260,130 | 131,810 | 128,325 |
| 40 to 44 years | 258,520 | 130,630 | 127,885 |
| 45 to 49 years | 280,630 | 140,575 | 140,055 |
| 50 to 54 years | 279,705 | 141,365 | 138,335 |
| 55 to 59 years | 233,780 | 118,750 | 115,030 |
| 60 to 64 years | 182,165 | 90,980 | 91,185 |
| 65 to 69 years | 125,700 | 61,790 | 63,905 |
| 70 to 74 years | 94,775 | 45,220 | 49,560 |
| 75 to 79 years | 76,045 | 35,205 | 40,835 |
| 80 to 84 years | 57,720 | 24,810 | 32,910 |
| 85 to 89 years | 33,595 | 12,090 | 21,505 |
| 90 to 94 years | 13,980 | 4,125 | 9,860 |
| 95 to 99 years | 3,405 | 805 | 2,600 |
| 100 years and over | 510 | 80 | 425 |
| Median age | 36.5 | 35.9 | 37.1 |
Alberta – Median age2 of the population in the last 90 years
The median age in Alberta was 36.5 years. In comparison, the median age of Canada was 40.6 years.

Chart E description: Alberta - Median age of the population in the last 90 years
| Median age | Census year | |||||||||
|---|---|---|---|---|---|---|---|---|---|---|
| 1921 | 1931 | 1941 | 1951 | 1961 | 1971 | 1981 | 1991 | 2001 | 2011 | |
| Canada | 23.9 | 24.7 | 27.0 | 27.7 | 26.3 | 26.2 | 29.6 | 33.5 | 37.6 | 40.6 |
| Alberta | 23.6 | 24.0 | 26.3 | 27.2 | 25.5 | 24.9 | 26.9 | 31.3 | 35.0 | 36.5 |
Families and households
In 2011, the number of census families3 in Alberta was 999,525, which represents a change of 10.5% from 2006. This compares to a growth rate for Canada of 5.5% over the same period.
In Alberta, 72.0% of census families were married couples in 2011, while 13.6% were common-law-couples and 14.5% were lone-parent families.

Family structure
| Geographic name | Total families | Married-couple families | Common-law-couple families | Lone-parent families | % change, census families, 2006 to 2011 | |||
|---|---|---|---|---|---|---|---|---|
| number | % | number | % | number | % | |||
| Canada † | 9,389,695 | 6,293,950 | 67.0 | 1,567,905 | 16.7 | 1,527,840 | 16.3 | 5.5 |
| Newfoundland and Labrador | 159,385 | 114,335 | 71.7 | 20,630 | 12.9 | 24,420 | 15.3 | 2.3 |
| Prince Edward Island | 40,850 | 29,695 | 72.7 | 4,570 | 11.2 | 6,580 | 16.1 | 4.2 |
| Nova Scotia | 270,065 | 184,870 | 68.5 | 38,460 | 14.2 | 46,735 | 17.3 | 1.0 |
| New Brunswick | 224,590 | 152,455 | 67.9 | 35,945 | 16.0 | 36,190 | 16.1 | 3.1 |
| Quebec † | 2,203,625 | 1,143,370 | 51.9 | 694,750 | 31.5 | 365,515 | 16.6 | 3.9 |
| Ontario † | 3,612,205 | 2,612,890 | 72.3 | 394,670 | 10.9 | 604,645 | 16.7 | 5.5 |
| Manitoba † | 327,875 | 232,635 | 71.0 | 39,060 | 11.9 | 56,185 | 17.1 | 4.8 |
| Saskatchewan † | 285,375 | 202,770 | 71.1 | 35,785 | 12.5 | 46,825 | 16.4 | 6.7 |
| Alberta † | 999,525 | 719,355 | 72.0 | 135,660 | 13.6 | 144,510 | 14.5 | 10.5 |
| British Columbia † | 1,238,155 | 887,990 | 71.7 | 160,360 | 13.0 | 189,805 | 15.3 | 6.6 |
| Yukon | 9,330 | 5,080 | 54.4 | 2,340 | 25.1 | 1,915 | 20.5 | 11.9 |
| Northwest Territories | 10,930 | 5,465 | 50.0 | 3,135 | 28.7 | 2,330 | 21.3 | 0.5 |
| Nunavut | 7,780 | 3,035 | 39.0 | 2,545 | 32.7 | 2,195 | 28.2 | 10.5 |
Alberta – Presence of children within couple families
Among couples (married and common-law) in Alberta, 49.6% were couples with children aged 24 and under at home. In comparison, as a whole, 46.9% of couples in Canada had children aged 24 and under at home.
Among couples with children aged 24 and under at home in the province of Alberta, 88.0% were intact families, that is, in which all children were the biological or adopted children of both parents, while 12.0% were stepfamilies, in which at least one child was the biological or adopted child of only one married spouse or common-law partner. For Canada as a whole in 2011, 12.6% of couples with children aged 24 and under at home were stepfamilies.

Alberta – Marital status

In Alberta, 59.3% of the total population aged 15 and over were either married (50.2%) or living with a common-law partner (9.2%).
The remaining 40.7% were not married and not living with a common-law partner, including those who were single (never-married), separated, divorced or widowed.
Note: Percentages may not total 100 percent due to random rounding.
| Marital status | Alberta | Canada | ||
|---|---|---|---|---|
| number | % | number | % | |
| Total - Population 15 years and over | 2,960,470 | 100.0 | 27,869,345 | 100.0 |
| Married or living with a common-law partner | 1,756,860 | 59.3 | 16,084,490 | 57.7 |
| Married (and not separated) | 1,484,705 | 50.2 | 12,941,965 | 46.4 |
| Living common-law | 272,155 | 9.2 | 3,142,525 | 11.3 |
| Not married and not living with a common-law partner | 1,203,615 | 40.7 | 11,784,855 | 42.3 |
| Single (never legally married) | 823,935 | 27.8 | 7,816,045 | 28.0 |
| Separated | 70,855 | 2.4 | 698,245 | 2.5 |
| Divorced | 177,375 | 6.0 | 1,686,035 | 6.0 |
| Widowed | 131,440 | 4.4 | 1,584,525 | 5.7 |
Alberta – Types of private households
There were 1,390,275 private households4 in Alberta in 2011, a change of 10.7% from 2006. Of these, 29.3% of households were comprised of couples with children aged 24 and under at home, a change of 6.4% compared with five years earlier.
| Household type5 | Alberta | Canada | ||
|---|---|---|---|---|
| number | % | number | % | |
| Total - Private households | 1,390,275 | 100.0 | 13,320,615 | 100.0 |
| Couple-family households with children6 | 407,145 | 29.3 | 3,524,915 | 26.5 |
| Couple-family households without children7 | 406,380 | 29.2 | 3,935,540 | 29.5 |
| Lone-parent family households8 | 128,330 | 9.2 | 1,375,450 | 10.3 |
| One-person households | 342,735 | 24.7 | 3,673,310 | 27.6 |
| Multiple-family households9 | 27,900 | 2.0 | 268,060 | 2.0 |
| Other households10 | 77,785 | 5.6 | 543,340 | 4.1 |
Alberta – Size of private households
The average household size in Alberta was 2.6 persons in 2011, compared to the Canadian average household size of 2.5 persons.
In Alberta, the proportion of total private households with only one person has increased over time, while the proportion of larger households (five or more persons) has decreased.

| Private household size | 1961 | 1966 | 1971 | 1976 | 1981 | 1986 | 1991 | 1996 | 2001 | 2006 | 2011 |
|---|---|---|---|---|---|---|---|---|---|---|---|
| One person | 12.0 | 13.9 | 14.9 | 17.3 | 19.4 | 21.4 | 21.9 | 22.5 | 23.2 | 24.6 | 24.7 |
| Five or more persons | 30.2 | 29.4 | 25.8 | 19.3 | 14.3 | 12.1 | 11.8 | 11.7 | 10.7 | 9.8 | 9.6 |
Alberta – Structural type of dwelling
In Alberta, 63.5% of private households lived in single-detached houses and 4.2% lived in apartments in buildings that have five or more storeys. The rest lived in other types of dwelling structures.
| Structural type of dwelling | Alberta | Canada | ||
|---|---|---|---|---|
| number | % | number | % | |
| Total - Structural type of dwelling | 1,390,275 | 100.0 | 13,320,615 | 100.0 |
| Single-detached house | 883,260 | 63.5 | 7,329,150 | 55.0 |
| Semi-detached house | 71,850 | 5.2 | 646,240 | 4.9 |
| Row house | 97,865 | 7.0 | 791,600 | 5.9 |
| Apartment, building that has five or more storeys | 58,205 | 4.2 | 1,234,770 | 9.3 |
| Apartment, building that has fewer than five storeys | 197,945 | 14.2 | 2,397,555 | 18.0 |
| Apartment, duplex | 33,505 | 2.4 | 704,485 | 5.3 |
| Other single-attached house11 | 1,060 | 0.1 | 33,310 | 0.3 |
| Movable dwelling12 | 46,590 | 3.4 | 183,510 | 1.4 |
Language
Alberta – Mother tongue

Chart J description: Alberta - Mother tongue and language spoken most often at home
Note: Counts for mother tongue as well as those for language spoken most often at home include single responses only.
In Alberta, 77.0% of the population reported English only as mother tongue, 1.9% reported French only, and 19.4% reported only a non-official language, in 2011. In comparison, the national percentages were 56.9% for English only, 21.3% for French only and 19.8% for non-official languages only.
In 2011, 85.7% of the population spoke English only most often at home, 0.7% spoke only French, and 10.5% spoke only a non-official language. In comparison, the national percentages were 64.8% for English only, 20.6% for French only and 11.1% for only a non-official language.
| Selected language | Mother tongue | Language spoken most often at home | ||
|---|---|---|---|---|
| number | % | number | % | |
| Total | 3,610,180 | 100.0 | 3,610,185 | 100.0 |
| English | 2,780,200 | 77.0 | 3,095,255 | 85.7 |
| French | 68,545 | 1.9 | 24,690 | 0.7 |
| Non-official language | 698,930 | 19.4 | 379,545 | 10.5 |
| Aboriginal language | 25,880 | 0.7 | 10,620 | 0.3 |
| Non-Aboriginal language | 673,055 | 18.6 | 368,935 | 10.2 |
| Multiple responses | 62,505 | 1.7 | 110,695 | 3.1 |
| Mother tongue | Mother-tongue retention13 (in percentage) |
||
|---|---|---|---|
| Total retention; language spoken at home at least on a regular basis | Complete retention; language spoken most often at home | Partial retention; language spoken at home on a regular basis | |
| Note: Counts for mother tongue and home language include single response of a language as well as multiple responses of a language with English and/or French. | |||
| English | 99.6 | 99.2 | 0.4 |
| French | 54.7 | 32.5 | 22.2 |
| Non-official language | 78.9 | 58.6 | 20.3 |
| Aboriginal language | 70.7 | 40.0 | 30.7 |
| Non-Aboriginal language | 79.2 | 59.3 | 19.9 |
Alberta – Non-official languages
In Alberta, the three most common mother tongues were German (2.3%), Tagalog (Pilipino, Filipino) (1.9%) and Panjabi (Punjabi) (1.5%), in 2011. In comparison, the most common mother tongues at the national level were Panjabi (Punjabi) (1.4%), Chinese, n.o.s. (1.3%) and Spanish (1.3%).
| Mother tongue | Number | Percentage of non-official language mother-tongue population | Percentage of total population |
|---|---|---|---|
| Note: Counts for mother tongue and home language include single response of a language as well as multiple responses of a language with English and/or French. | |||
| German | 84,835 | 11.3 | 2.3 |
| Tagalog (Pilipino, Filipino) | 69,640 | 9.2 | 1.9 |
| Panjabi (Punjabi) | 53,315 | 7.1 | 1.5 |
| Chinese, n.o.s. | 51,420 | 6.8 | 1.4 |
| Spanish | 46,840 | 6.2 | 1.3 |
| Cantonese | 36,790 | 4.9 | 1.0 |
| Arabic | 31,795 | 4.2 | 0.9 |
| Ukrainian | 26,740 | 3.6 | 0.7 |
| Vietnamese | 22,385 | 3.0 | 0.6 |
| Urdu | 22,160 | 2.9 | 0.6 |
Alberta – Bilingualism
| Age groups | Mother tongue | |||
|---|---|---|---|---|
| Total | English | French | Non-official language | |
| Note: Counts for mother tongue include single responses only. Consequently, the total excludes multiple responses. | ||||
| Total | 6.3 | 5.0 | 85.8 | 3.9 |
| 0 to 19 | 6.5 | 6.0 | 80.3 | 4.7 |
| 20 to 44 | 7.4 | 6.3 | 89.9 | 4.4 |
| 45 to 64 | 5.4 | 3.2 | 86.0 | 3.7 |
| 65 and over | 4.5 | 2.0 | 81.3 | 2.1 |
| Knowledge of official languages | Number | Percentage |
|---|---|---|
| Total | 3,610,185 | 100.0 |
| English only | 3,321,815 | 92.0 |
| French only | 3,205 | 0.1 |
| English and French | 235,565 | 6.5 |
| Neither English nor French | 49,600 | 1.4 |
Symbols:
- ···
- not applicable
- †
- excludes census data for one or more incompletely enumerated Indian reserves or Indian settlements. For further information, refer to Notes.
- ¶
- incompletely enumerated Indian reserve or Indian settlement. For further information, refer to Notes.
- A
- adjusted figure due to boundary change. For further information, refer to Content considerations.
- E
- use with caution. For further information, refer to Cautionary note.
Source:
Statistics Canada. 2012. Focus on Geography Series, 2011 Census. Statistics Canada Catalogue no. 98-310-XWE2011004. Ottawa, Ontario. Analytical products, 2011 Census. Last updated October 24, 2012.
Related data:
- 2011 Census Topic-based tabulations – Alberta
- 2011 Census Highlight tables – Alberta
- 2011 Census Data Navigator – Alberta
- 2011 NHS Focus on Geography Series – Alberta
- Date modified: