Archived Content
Information identified as archived is provided for reference, research or recordkeeping purposes. It is not subject to the Government of Canada Web Standards and has not been altered or updated since it was archived. Please contact us to request a format other than those available.
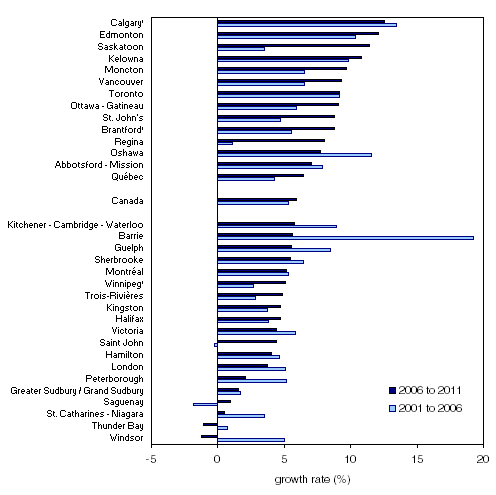
Figure 5
Population growth rate (in percentage) of census metropolitan areas, 2001 to 2006 and 2006 to 2011
Description
This chart shows the population growth, in percentage, of Canada's 33 census metropolitan areas from 2001 to 2006, then from 2006 to 2011. The CMAs are shown in descending order of growth for the period from 2006 to 2011. For each area, the first value is for 2001 to 2006 and the second for 2006 to 2011. The population growth rates are 13.4% and 12.6% for Calgary,Footnote 1 10.4% and 12.1% for Edmonton, 3.5% and 11.4% for Saskatoon, 9.8% and 10.8% for Kelowna, 6.5% and 9.7% for Moncton, 6.5% and 9.3% for Vancouver, 9.2% and 9.2% for Toronto, 5.9% and 9.1% for Ottawa - Gatineau, 4.7% and 8.8% for St. John's, 5.5% and 8.7% for Brantford,Footnote 1 1.1% and 8.0% for Regina, 11.6% and 7.7% for Oshawa, 7.9% and 7.0% for Abbotsford - Mission and 4.2% and 6.5% for Québec. Next is Canada's percentage growth at 5.4% between 2001 and 2006 and 5.9% between 2006 and 2011. The next growth rates are 8.9% and 5.7% for Kitchener - Cambridge - Waterloo, 19.2% and 5.6% for Barrie, 8.5% and 5.5% for Guelph, 6.4% and 5.5% for Sherbrooke, 5.3% and 5.2% for Montréal, 2.7% and 5.1% for Winnipeg,Footnote 1 2.8% and 4.9% for Trois-Rivières, 3.8% and 4.7% for Kingston, 3.8% and 4.7% for Halifax, 5.8% and 4.4% for Victoria, -0.2% and 4.4% for Saint John, 4.6% and 4.1% for Hamilton, 5.1% and 3.7% for London, 5.1% and 2.1% for Peterborough, 1.7% and 1.6% for Greater Sudbury/Grand Sudbury, -1.8% and 1.0% for Saguenay, 3.5% and 0.5% for St. Catharines - Niagara, 0.8% and -1.1% for Thunder Bay and 5.0% and -1.3% for Windsor.

Sources: Statistics Canada, censuses of population, 2001, 2006 and 2011
- Date modified: