Archived Content
Information identified as archived is provided for reference, research or recordkeeping purposes. It is not subject to the Government of Canada Web Standards and has not been altered or updated since it was archived. Please contact us to request a format other than those available.
Figure 1
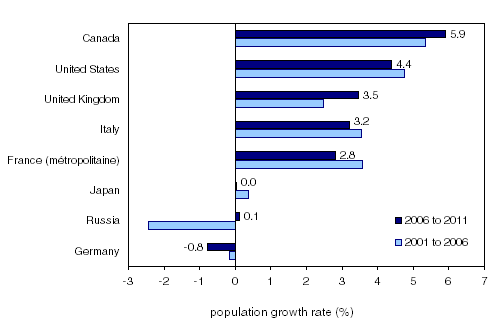
Population growth rate (in percentage) of the G8 countries, 2001 to 2006 and 2006 to 2011
Description
This chart shows the population growth, in percentage, of the G8 member countries for two periods, 2001 to 2006 and 2006 to 2011. Between both 2001 and 2006 and 2006 and 2011, Canada recorded the highest growth, followed by the United States. The following are the values for each country, beginning with those for the period 2001 to 2006 followed by those for the period 2006 to 2011: 5.4% and 5.9% in Canada, 4.7% and 4.4% in the United States, 2.5% and 3.5% in the United Kingdom, 3.5% and 3.2% in Italy, 3.6% and 2.8% in France (métropolitaine), 0.4% and 0.0% in Japan, -2.4% and 0.1% in Russia, -0.2% and -0.8% in Germany.

Sources: Statistics Canada, 2011 Census of Population, and calculation from the data of the U.S. Census Bureau – Population Estimates Program, Instituto Nazionale di Statistica (Italy), National Institute of Statistics and Economic Studies (France), United Kingdom Office for National Statistics, Statistics Bureau of Japan, Federal Statistical Office of Germany and Russian Federation Federal State Statistics Service.
- Date modified: